
Unemployment is at a 50-year low. The low rate is not from an unusually high job-finding rate out of unemployment but, rather, an unusually low rate at which people enter unemployment. The low entry rate reflects a long-run downward trend likely due to population aging, better job matches, and other structural factors. These developments lowered the long-run unemployment rate trend. At the end of 2019, the unemployment rate was below the trend but no more so than in previous business cycle peaks, indicating that the labor market is no tighter.
The current U.S. unemployment rate is at a 50-year low. Is it so low because the rate at which people find jobs and leave unemployment is unusually high, or because the rate at which people become unemployed is unusually low? How does it compare to the previous business cycle peaks?
In this Letter, we analyze the underlying transitions between unemployment, employment, and out of the labor force (OLF) and assess the trend and the cycle of the current unemployment rate. We find that current unemployment is so low not because of the high job-finding rate but because of low entry rates into unemployment, from both employment and OLF. In fact, at the end of 2019 the job-finding rate remained below its peak reached prior to the 2007-09 recession, while the rate at which people separated from jobs into unemployment was at its lowest point in four decades.
We also find that the current unemployment rate is lower than during the previous business cycle peaks—2000 and 2007—entirely because of the declining unemployment rate trend and not because of lower unemployment on a cyclical basis. This decline in the unemployment rate trend has been driven by downward trends in the entry rates into unemployment, both from employment and from OLF, likely due to population aging, better quality matches between workers and jobs, and other structural factors. Overall, comparing the actual and trend unemployment rates over time, we find that the current labor market is not tighter than in 2000 or 2007, even though the unemployment rate is lower. These findings might help explain moderate wage growth and limited price inflation despite the historically low unemployment rate (Petrosky-Nadeau and Valletta 2019).
Ins and outs of unemployment
The number of unemployed people in the economy in any given month is a sum of those who became newly unemployed—that is, those who transitioned into unemployment—and those who remained unemployed from the previous month—that is, those who did not transition out of unemployment. People can transition into unemployment from employment when they quit or lose a job. They also can move into unemployment from out of the labor force; this happens when a non-employed person starts actively searching for a job. Similarly, people can transition out of unemployment to employment by finding a job, or to OLF by stopping their active job search.
At any point in time, the unemployment rate can be well approximated by a function of the transition rates between unemployment, employment, and out of the labor force (Shimer 2012). The transition rate between any two labor market states (or activities) is calculated as the ratio of the number of people who move between those states to the number of people in the initial state. This function defines a relationship between the unemployment rate and the six transition rates. For example, as the transition rates into unemployment fall or the transition rates out of unemployment rise, the unemployment rate falls. We use this relationship to examine which of the transition rates contributed the most to the recent decline in the unemployment rate.
We start by examining the behavior of the transition rates between labor market states over time. We construct transition rates from the Current Population Survey micro data from January 1976 through December 2019; see Hornstein and Kudlyak (2020) for more details.
Figure 1 shows the monthly transition rates and their smoothed respective trends. Panel A shows that, during expansions, the transition rates out of unemployment to employment (UE) and to OLF (UN) typically rise. This is also the case in the current expansion. However, while these transition rates have risen, they are not unusually high by historical standards. In fact, the UE rate remains below its 2007 peak.
Panel B shows that, during expansions, transition rates into unemployment typically fall. But, unlike the transition rates out of unemployment, the transition rates to unemployment from employment (EU) and from OLF (NU) are currently at historically low levels. These rates, especially the EU rate, exhibit a noticeable long-run downward trend.
Figure 1
Transition rates between labor market statuses
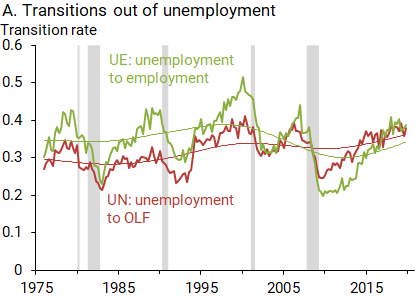
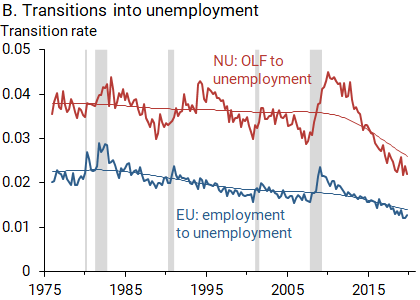
Note: Quarterly averages of monthly seasonally adjusted Current Population Survey (CPS) data, January 1976 to December 2019. Data reflect ratio of number of people moving from one state into another state to number of people in initial state: UE=from unemployment to employment; EU=from employment to unemployment; UN=from unemployment to out of the labor force (OLF); NU=from OLF to unemployment. Thin lines show smoothed trends for transition of same color. Not shown: EN=from employment to OLF; NE=from OLF to employment. See Hornstein and Kudlyak (2020) for details.
While the transition rates between employment and OLF (EN and NE, not shown) do not directly affect the transitions in and out of unemployment, they indirectly affect the unemployment rate by changing the number of people in employment and in OLF. Both of these rates show little deviation from their trends. Similar to the job-finding rate out of unemployment, the job-finding rate from OLF (NE) has not yet reached its pre-recession peak by the end of 2019.
The key takeaway is that the transition rates out of unemployment are comparable with their historical levels, while transition rates into unemployment are at their lowest levels in four decades. The implication is that the current historically low unemployment rate most likely stems from the low transition rates into unemployment. We examine this idea directly in the next section.
Which transition rates best explain current low unemployment?
To quantify the contribution of each of the transition rates to unemployment, we use the relationship between the unemployment rate and the six transition rates and construct different scenarios for the unemployment rate by varying the underlying transition rates. Specifically, we calculate the contributions of a single transition by allowing it to vary over time as observed in the data, while holding the other five transition rates fixed at their sample averages. This exercise is intended to account for the separate contributions from different transitions, but it does not reveal what underlying economic forces could be driving the different transition rates. Nevertheless, the exercise identifies where to look for causes of the changing transition rates and consequent low unemployment rate. For example, Crump et al. (2019) point to more women entering the labor force, the decline in job destruction and reallocation intensity, and the dual aging of workers and businesses. Pries and Rogerson (2019) point to improved quality of job matches as the driving force behind the long-run decline in the transition rate into unemployment from employment. Barnichon and Nekarda (2012) find that population aging, disability, and the opioid crisis have driven the long-run decline in the transition into unemployment from OLF.
Figure 2 shows the actual unemployment rate (gold line) and two alternative scenarios—one driven by the job-finding rate (green line), and one by the job-separation rate (blue line). All series are shown as percent deviations from their respective sample averages for easier comparison. The figure suggests two important points. First, the scenario driven by the job-separation rate shows a much larger decline from its average in recent years compared with the one driven by the job-finding rate. Second, this differs from past recoveries; in past business cycle peaks, the unemployment rate was low mainly because the job-finding rate was high.
Figure 2
Changes to unemployment from EU and UE scenarios
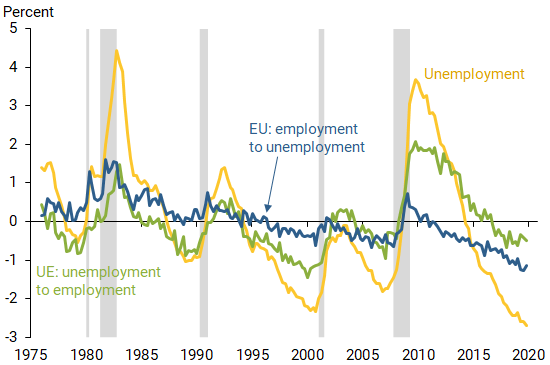
Note: Percentage point deviations from sample averages for quarterly averages of monthly seasonally adjusted CPS data, January 1976 to December 2019. See Hornstein and Kudlyak (2020) for details.
The evidence in Figure 2 confirms that the current ultralow unemployment rate stems primarily from historically low transition rates into unemployment and not from unusually high job-finding rates.
Trend and cycle of the current low unemployment rate
We next assess how much the trends in the transition rates contribute to the unemployment rate trend. We construct a trend in the unemployment rate from the transition rate trends between employment, unemployment, and OLF, using the relationship that links the transition rates to the unemployment rate. This measure of the unemployment rate trend is analogous to conventional estimates of the long-run natural rate of unemployment. Figure 3 shows the unemployment rate and its estimated long-run trend.
Figure 3
Unemployment rate and estimated long-run trend
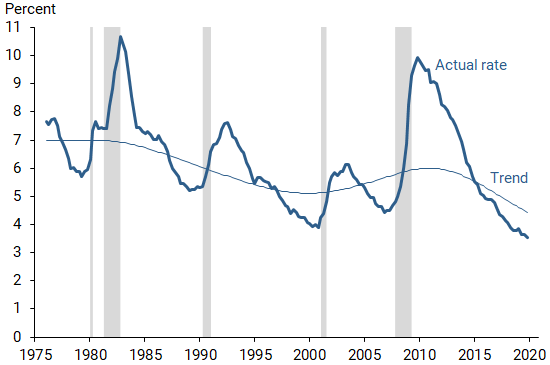
Note: Trend constructed from transition rate trends between employment, unemployment, and OLF.
First, we find that the unemployment rate trend fell substantially over the past decade. This decline accounts for the entire difference between the unemployment rate during the previous business cycle peaks of 2000 and 2007 and current unemployment. For example, the unemployment rate at the end of 2019 was 0.9 percentage point lower than in 2007, while its trend is 1.2 percentage points lower than in 2007.
Second, further analysis (Hornstein and Kudlyak 2020) shows that the entire decline in the unemployment rate trend during the past decade can be attributed to the long-run declines in the transition rates into unemployment, equally split by the decline in the trends of the transition rates into unemployment from employment and from OLF.
Finally, the estimated long-run trend for unemployment is 4.4% as of the end of 2019. Comparing the actual and trend unemployment rates over time shows that the recent gap between them is similar to the gaps in 2000 and 2007, suggesting similar degrees of labor market tightness.
Conclusion
In sum, the current ultra-low unemployment rate is not due to a particularly high job-finding rate but rather to unusually low rates of people moving into unemployment, which reflects the long-run downward trend.
Comparing the actual and trend unemployment rates over time shows that the recent gap between them is similar to the gaps during the past two labor market peaks, in 2000 and 2007. This suggests that the current labor market is no tighter than during the previous peaks. These findings can help explain apparent anomalies in the current labor market, such as moderate wage growth and limited price inflation despite a historically low unemployment rate.
Marianna Kudlyak is a research advisor in the Economic Research Department of the Federal Reserve Bank of San Francisco.
Mitchell G. Ochse is a research associate in the Economic Research Department of the Federal Reserve Bank of San Francisco.
References
Barnichon, Regis, and Christopher J. Nekarda. 2012. “The Ins and Outs of Forecasting Unemployment: Using Labor Force Flows to Forecast the Labor Market.” Brookings Papers on Economic Activity, Fall, pp. 83–117.
Crump, Richard K., Marc Giannoni, Stefano Eusepi, and Aysegul Sahin. 2019. “A Unified Approach to Measuring u*.” Brookings Papers on Economic Activity, Spring, pp. 143–214.
Hornstein, Andreas, and Marianna Kudlyak. 2020. “Why Is Current Unemployment So Low?” FRB San Francisco, Working Paper 2020-05.
Petrosky-Nadeau, Nicolas, and Robert G. Valletta. 2019. “Unemployment: Lower for Longer?” FRBSF Economic Letter 2019-21 (August 19).
Pries, Michael J., and Richard Rogerson. 2019. “Declining Worker Turnover: The Role of Short Duration Employment Spells.” NBER Working Paper 26019.
Shimer, Robert. 2012. “Reassessing the Ins and Outs of Unemployment.” Review of Economic Dynamics 15(2), pp. 127–148.
Opinions expressed in FRBSF Economic Letter do not necessarily reflect the views of the management of the Federal Reserve Bank of San Francisco or of the Board of Governors of the Federal Reserve System. This publication is edited by Anita Todd and Karen Barnes. Permission to reprint portions of articles or whole articles must be obtained in writing. Please send editorial comments and requests for reprint permission to research.library@sf.frb.org