

Global supply chain disruptions following the onset of the COVID-19 pandemic contributed to the rapid rise in U.S. inflation over the past two years. Evidence suggests that supply chain pressures pushed up the cost of inputs for goods production and the public’s expectations of higher future prices. These factors accounted for about 60% of the surge in U.S. inflation beginning in early 2021. Supply chain pressures began easing substantially in mid-2022, contributing to the slowdown in inflation.
Following the onset of the COVID-19 pandemic, global shipping and transportation costs surged, and delivery times and backlogs spiked to historically high levels. The resulting supply shortages added significant pressure to inflation.
This Economic Letter examines the quantitative contribution of global supply chain disruptions to the run-up of U.S. inflation during the past two years. Our evidence suggests that an increase in supply chain pressures can lead to a sizable increase in overall personal consumption expenditures (PCE) price inflation. Supply chain disruptions increase input costs and raise the public’s expectations for higher prices. We estimate that these effects contributed about 60% of the above-trend run-up of headline inflation in 2021 and 2022.
Measuring global supply chain pressures
We measure supply chain disruptions using the Global Supply Chain Pressure Index (GSCPI) constructed by the Federal Reserve Bank of New York (Akinci et al. 2022). The GSCPI summarizes information from 27 monthly indicators of transportation costs—such as the Baltic Dry Index, the Harpex index, and the Bureau of Labor Statistics airfreight cost indexes—and supply chain-related components from the Purchasing Managers’ Index surveys for manufacturing firms in seven major economies, including China, the euro area, Japan, South Korea, Taiwan, the United Kingdom, and the United States.
Figure 1 shows the GSCPI (blue line) from January 1997 to April 2023. The GSCPI is normalized to have an average value of zero over the full time series. The vertical axis indicates how many standard deviations the index is above or below the average. As global supply conditions change, the GSCPI fluctuates around its average level. For example, the spike in 2011 reflects disruptions to automobile production and distribution following Japan’s Tohoku earthquake and tsunami. The index climbed again in 2017, following the China–U.S. trade disputes. After the onset of the COVID-19 pandemic, the GSCPI jumped to unprecedented levels, over four standard deviations above its average value by the end of 2021. Since mid-2022, supply chain pressures have eased steadily, with the GSCPI gradually returning to its historical average.
Figure 1
Global Supply Chain Pressure Index and PCE inflation
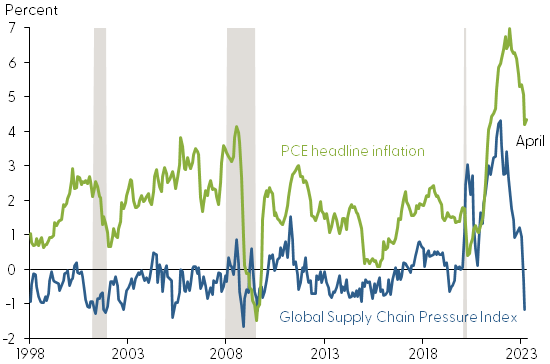
Source: FRB New York, Bureau of Economic Analysis, and authors’ calculations. Gray shading indicates NBER recession dates.
Movements in the GSCPI are modestly correlated with those in headline PCE inflation (green line), with a correlation of about 0.53 over the full sample. This correlation partly reflects the surges in both series during the pandemic. In the pre-pandemic sample (1997–2019), the correlation was much lower, about 0.24. In estimating the effects of changes in the GSCPI on inflation, we focus on the pre-pandemic sample period from 1998 to 2019, to ensure that our findings would not be driven by the special pandemic conditions.
How does inflation respond to supply chain shocks?
The correlation between inflation and the GSCPI reflects the combined effects of a variety of factors. To isolate the effects of changes in supply chain constraints on inflation, we first identify a GSCPI shock, which measures unexpected changes in the GSCPI that are not explained by fluctuations in macroeconomic conditions. In particular, our estimation controls for changes in aggregate demand conditions, measured by six-month lags of the unemployment gap, and in monetary policy, measured by two-year U.S. Treasury yields.
We use the local projections method—a statistical tool proposed by Jordà (2005)—to project how inflation responds over time to a surprise increase in the GSCPI of one standard deviation above its average level. The size of this GSCPI shock is relatively modest compared with the sharp increase in the GSCPI during the pandemic.
Figure 2 shows the average response of headline PCE inflation to a surprise GSCPI increase of one standard deviation relative to its average value (blue line). It also shows the confidence band (blue shading), indicating statistical uncertainty in estimating the responses. Assuming that the model is correctly specified, the shaded area contains the actual value of the inflation response to the GSCPI shock roughly two-thirds of the time.
Figure 2
Responses of headline PCE inflation to GSCPI shocks
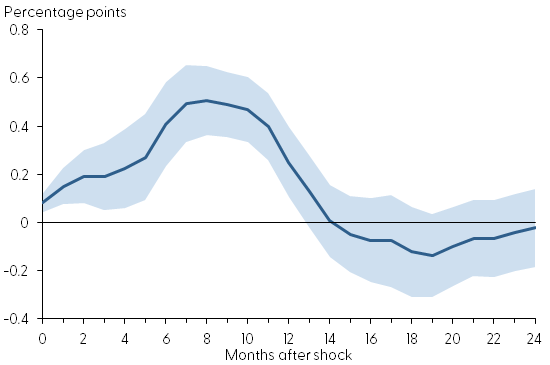
Note: Blue shading indicates 68% confidence band.
The figure illustrates that a one standard deviation shock to the GSCPI leads to an increase in headline PCE inflation of about 0.5 percentage point at the peak. The effects are relatively short lived, statistically vanishing about a year after the impact.
Since supply chain disruptions directly constrain supplies of traded goods, with only indirect effects on services, one would expect a GSCPI shock to boost goods price inflation more than overall inflation. This is the case in our model results. We find that a one standard deviation shock to the GSCPI raises PCE goods inflation by up to 1.5 percentage points relative to the pre-shock level, about three times the peak effect on overall inflation.
We also find that a GSCPI shock raises unemployment, suggesting that it acts like an adverse supply shock that raises inflation but reduces economic activity. We estimate that a one standard deviation shock to the GSCPI raises the unemployment rate by up to 0.7 percentage point relative to the pre-shock level. These findings are in line with empirical studies of the effects of global supply chain disruptions on inflation and economic activity in the euro area (see, for example, Finck and Tillmann 2023).
How supply chain constraints can affect inflation
A surprise increase in the GSCPI can raise inflation through several channels.
The first channel works through inflation expectations. Disruptions to global supply chains are often associated with surges in commodity prices. Studies have shown that people’s inflation expectations—especially for short-term, one-year ahead inflation—are sensitive to commodity price fluctuations (see, for example, Glick et al. 2021). We examine the responses of one-year-ahead inflation expectations from the Philadelphia Fed’s Survey of Professional Forecasters (SPF) following surprise changes in the GSCPI. We find that a shock that raises the GSCPI one standard deviation increases SPF short-term inflation expectations by up to 0.1 percentage point. This estimate suggests that a shock that raises the GSCPI four standard deviations above its mean, as observed from late 2020 to late 2021, would increase one-year-ahead inflation expectations by up to 0.4 percentage point, or about 40% of the actual increase in the SPF short-term inflation expectations during the same period—that is, from 2.1% in the first quarter of 2021 to 3.0% in the first quarter of 2022. The effects of a GSCPI shock on long-term SPF inflation expectations, such as for 10 years ahead, are more muted.
The second channel works through import prices. A tightening of supply chain constraints can raise imported goods prices, which are then passed through to consumer prices. Using a similar local projections model, we estimate that a one standard deviation shock to the GSCPI raises inflation for imported goods by up to 0.9 percentage point at the peak. However, since the share of imported goods makes up only about 5% of total PCE, the pass-through from the import price channel to final consumer price inflation is likely to be limited.
The third channel works through the costs of intermediate inputs. In response to supply chain disruptions, businesses would pass increases in intermediate input costs through to consumer prices. We use a similar local projections model to examine the quantitative importance of this channel. We find that a one standard deviation GSCPI shock raises 12-month changes in the producer price index (PPI) of crude materials by up to 10 percentage points. The same shock raises intermediate materials PPI inflation to a smaller extent, about 3.5 percentage points at the peak. The effects on finished goods PPI inflation are even smaller, about 2.5 percentage points. Thus, a GSCPI shock raises input prices significantly. However, as costs move further along the production chain, from initial inputs to intermediate goods, PPI inflation becomes less sensitive to a GSCPI shock. The effects of the shock on final consumer goods inflation are even more muted, as shown in Figure 1. This “snake effect,” whereby the impact of the shock dissipates as it works its way through the supply chain, is consistent with economic theory (see, for example, Huang and Liu 2001).
Contributions of GSCPI shocks to recent inflation
To assess the quantitative contributions of GSCPI shocks to the run-up of PCE inflation in the past two years, we use a structural vector-autoregression model that takes into account the joint dynamics between the GSCPI, inflation, and the control variables for demand conditions and monetary policy. We estimate the model using data from January 1998 to March 2023, and then compute the contributions of GSCPI shocks to the deviations of inflation from its sample average. This GSCPI-driven inflation is the predicted path of PCE inflation from our model, assuming that it has only been affected by shocks to the GSCPI.
Figure 3 shows headline PCE inflation (gray line) separated into three components: trend inflation (green bars), contributions of the GSCPI (blue bars), and contributions of other factors (gold bars) from April 2021 to March 2023. During this period, GSCPI shocks contributed on average about 60% of the above-trend run-up of headline inflation. Our finding here is in line with recent analysis by Shapiro (2022), using a different methodology.
Figure 3
Contributions of supply chain shocks to recent PCE inflation
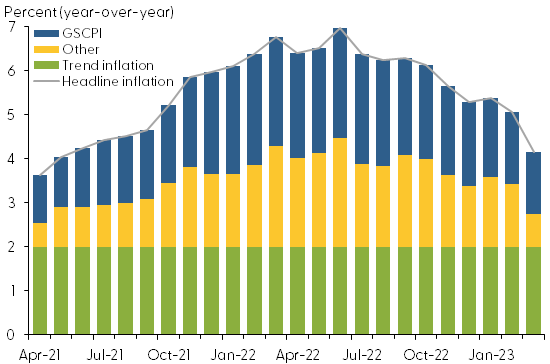
Source: Bureau of Economic Analysis and authors’ calculations.
Since mid-2022, the contributions of GSCPI shocks have declined from 2.5 to 1.4 percentage points, and headline inflation has also slowed, reflecting the recent easing of supply chain constraints. Although the GSCPI fell back closer to its historical average around the beginning of this year (see Figure 1), the contribution of the GSCPI shock to inflation remains positive, reflecting the delayed effects of the shock on inflation.
Conclusion
Supply shortages caused by global supply chain disruptions following the onset of the COVID-19 pandemic have added pressure on U.S. inflation. Our analysis suggests that supply chain shocks can have significant impacts on PCE inflation by raising inflation expectations and intermediate input costs. We estimate that supply chain disruptions contributed on average about 60% of the run-up of U.S. inflation during the past two years. Since mid-2022, indicators show that increased pressure from the supply chain disruptions have been easing gradually, which has contributed to the slowdown in inflation.
Zheng Liu
Vice President and Director of the Center for Pacific Basin Studies, Economic Research Department, Federal Reserve Bank of San Francisco
Thuy Lan Nguyen
Senior Economist, Economic Research Department, Federal Reserve Bank of San Francisco
References
Akinci, Ozge, Gianluca Benigno, Ruth Cesar Heymann, Julian di Giovanni, Jan J.J. Groen, Lawrence Lin, and Adam I. Noble. 2022. “The Global Supply Side of Inflationary Pressures.” Liberty Street Economics, FRB New York, January 28.
Finck, David, and Peter Tillmann. 2023. “The Macroeconomic Effects of Global Supply Chain Disruptions.” Bank of Finland, BOFIT Discussion Paper 14/2022.
Glick, Reuven, Noah Kouchekinia, Sylvain Leduc, and Zheng Liu. 2021. “Do Households Expect Inflation When Commodities Surge?” FRBSF Economic Letter 2021-19 (July 12).
Huang, Kevin X.D., and Zheng Liu. 2001. “Production Chains and General Equilibrium Aggregate Dynamics.” Journal of Monetary Economics 48(2), pp. 437–462.
Jordà, Òscar. 2005. “Estimation and Inference of Impulse Responses by Local Projections.” American Economic Review 95(1), pp. 161–182.
Shapiro, Adam Hale. 2022. “How Much Do Supply and Demand Drive Inflation?” FRBSF Economic Letter 2022-15 (June 21).
Opinions expressed in FRBSF Economic Letter do not necessarily reflect the views of the management of the Federal Reserve Bank of San Francisco or of the Board of Governors of the Federal Reserve System. This publication is edited by Anita Todd and Karen Barnes. Permission to reprint portions of articles or whole articles must be obtained in writing. Please send editorial comments and requests for reprint permission to research.library@sf.frb.org