

Given steady declines in price inflation for core goods and expectations that rent inflation will moderate over time, the outlook for nonhousing core services—or “supercore”—inflation has grown in importance. State-level data document a typically weak relationship between this indicator and unemployment rates, highlighting the stickiness of supercore inflation. The data show that its sensitivity to labor markets strengthened early in the pandemic recovery in connection with strong demand for service workers. However, it’s uncertain whether this sensitivity will remain heightened or return to its persistent pre-pandemic weakness.
Inflation has declined substantially since its peak in June 2022. This largely reflects lower energy prices and more moderate price increases for core goods, as global supply chain constraints have eased and consumers have resumed more normal spending patterns, shifting back from goods toward services. In contrast, inflation for core services continues to rise, in part due to lingering pandemic-related increases in shelter prices that are still affecting official inflation statistics (Lansing, Oliveira, and Shapiro 2022). However, because new rents are rising more slowly, policymakers expect the housing sector to contribute less to core services inflation over the next two years.
As a result, policymakers have highlighted a narrower category of core services that excludes shelter—often called “supercore” inflation—as one important indicator of progress on inflation (see, for example, Powell 2022). One concern is that supercore inflation has remained elevated over the past two years. Given the importance of labor costs in the services sector, supercore inflation is expected to moderate as the labor market and economic activity slow in response to higher interest rates. The size of this effect will depend on the strength of the relationship between supercore inflation and the labor market.
In this Economic Letter, we examine the relationship between inflation and labor market strength using state-level data. We look separately at inflation for goods, overall services, housing services, and supercore services, and we measure labor market strength using demand-driven shocks to state unemployment rates. We find that, while demand-driven declines in unemployment do push up services inflation, the effect is primarily through rent inflation. In contrast, supercore inflation typically shows little sensitivity to local labor market conditions, which highlights its persistence or “stickiness.” Still, we also document that this sensitivity increased in 2021, the latest year of state data available. If this sensitivity remains relatively high, then easing labor markets could help inflation fall significantly. On the other hand, with the return of pre-pandemic patterns of consumer saving and spending, there’s an important risk that the low sensitivity of supercore inflation to labor market conditions could return. In that case, reducing supercore inflation would necessitate a more pronounced moderation in overall demand.
Inflation and its supercore
For most of the decade preceding the pandemic, inflation ran slightly below the Federal Reserve’s target of 2%. This changed dramatically after economic activity resumed in early 2021, and inflation started to rise rapidly. A mix of strong demand, supported by accommodative fiscal and monetary policies, and global supply constraints helped push prices up (Jordà et al. 2022 and Shapiro 2022). The Federal Reserve responded by signaling a rise in interest rates in the second half of 2021, then hiking the federal funds rate 5 percentage points over roughly a year. Partly as a result, inflation started to moderate. Figure 1 shows that headline inflation, as captured by the 12-month change in the personal consumption expenditures (PCE) price index, peaked in the middle of last year and has steadily declined since then.
Figure 1
Core and headline PCE inflation
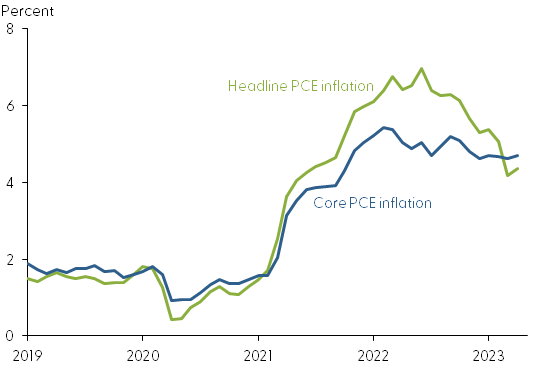
Source: Bureau of Economic Analysis.
Figure 1 also shows that the decline in core inflation—which removes volatile energy and food sectors and is often a better predictor of future headline inflation—has been much more moderate. This muted decline largely reflects price changes in the services sector. In contrast to the rapid fall in core goods price inflation over the past year-and-a-half, core services inflation has been rising steadily over the past two years (Figure 2). The price index for core services includes shelter prices, such as rent inflation, which are partly driving the rise in core services inflation. Shelter prices are expected to cool given that newly negotiated rents have begun to moderate. However, core services inflation, even after excluding shelter—known as supercore inflation—has remained steadily high since the middle of 2022. Since nonhousing core services account for more than half of the core PCE index, movements in these prices are a key component of core inflation that policymakers are watching closely.
Figure 2
Supercore, core services, and core goods PCE inflation
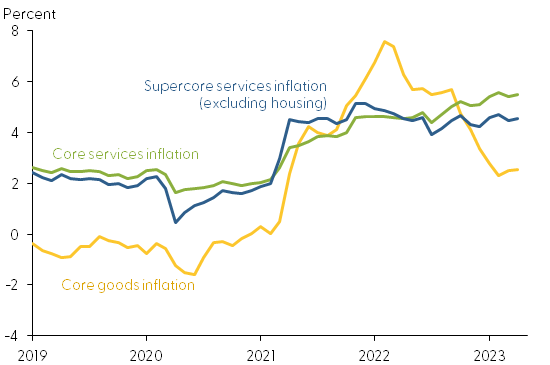
Source: Bureau of Economic Analysis and authors’ calculations.
Supercore inflation and the labor market
The services sector is labor intensive, such that wages and salaries are an important component of these firms’ overall costs. As a result, one would expect the relationship between labor market conditions and services inflation, known as the slope of the Phillips curve, to be strong.
We examine this relationship using state-level data on services inflation and unemployment gaps, an indicator of labor market activity. We use detailed data available for state PCE inflation rates between 2009 and 2021 that provide a breakdown between goods and services inflation, in addition to data on rent inflation and supercore inflation. We define the unemployment gap as the difference between a state’s unemployment rate and its natural rate of unemployment, captured by a 10-year trailing average of the state unemployment rate. A weak labor market thus has a positive unemployment gap, with the unemployment rate above its natural rate.
One advantage of using state-level data is the ability to account for the effects of changes in monetary policy. For instance, monetary policy tends to lower interest rates when the national unemployment gap increases and raise rates when the gap decreases. Since inflation is negatively affected by interest rates, this policy response would tend to obscure the relationship between inflation and the unemployment gap. We account for monetary policy actions to help reveal the true causal effect of labor market conditions on inflation. Using state data allows us to easily remove national effects by measuring state inflation and unemployment gaps relative to their yearly national averages.
We make three other adjustments in our empirical analysis. We account for lagged movements in a state’s inflation expectations, which we measure using micro data available since 2013 from the New York Fed’s Survey of Consumer Expectations. Because we’re interested in how changes in labor demand affect inflation, we also isolate demand-driven movements in state unemployment gaps using an instrumental variables technique. Specifically, we estimate movements in each state’s unemployment gap due to movements in national oil prices and crop prices based on the state’s historical GDP shares from oil production and agriculture. We then replace the state’s actual unemployment gaps with these demand-driven gaps in our regression analysis of inflation. Our third adjustment redefines all variables in the analysis by subtracting state sample means to account for any time-invariant state characteristics.
Before presenting the results from the regression analysis using these adjustments, we present a simple scatter plot with the raw data. Each data point in Figure 3 shows the relationship between a specific state’s services inflation and unemployment gap at a given point in time in our sample. The figure indicates a clear negative relationship between services inflation and unemployment gaps, such that lower unemployment gaps tend to be associated with higher rates of services inflation. This becomes more pronounced with the most recent data available through 2021. The lines in the figure also show a negative Phillips curve slope from estimating the relationship using our regression analysis.
Figure 3
Services inflation and unemployment gap
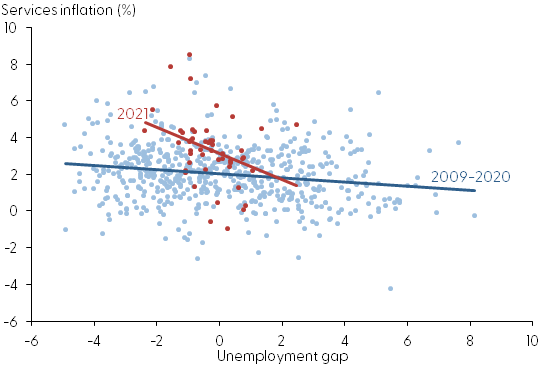
Source: FRB New York and authors’ calculations.
However, this negative relationship is largely driven by housing inflation. We show this by formally estimating the Phillips curves separately for rent inflation and supercore inflation. The bars in Figure 4 report the estimated slopes for these two categories and for services inflation. Dark blue whisker bands indicate how precise the relationships are. For instance, if the band includes zero, we cannot statistically reject the possibility that there is no relationship between these measures of inflation and the unemployment gap. As the figure shows, rent inflation is highly negatively related to the unemployment gap, with an estimated slope of roughly –1.5. In contrast, the relationship for supercore inflation is much weaker, with an estimated slope of –0.09 that is not statistically significant. As such, these results suggest that a slowdown in economic activity may lead to only a muted decline in supercore inflation, highlighting its stickiness (see also Shapiro 2023).
Figure 4
Phillips curve slope estimates
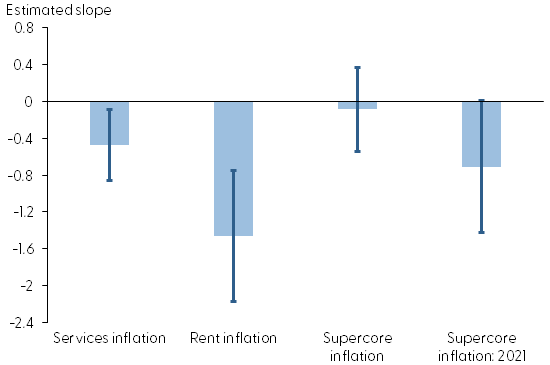
Source: Bureau of Economic Analysis and authors’ calculations.
Effects of the pandemic
Since the pandemic, supercore inflation may have become more sensitive to unemployment gaps because of acute labor shortages and broader supply constraints. We examine this possibility by allowing the slope of the Phillips curve to differ during 2020 and 2021 compared with previous years. Concentrating on 2021 to emphasize the recovery period, we find that the slope of the Phillips curve steepened substantially that year, as shown in the last column of Figure 4. In standard macroeconomic models, such a steepening could reflect businesses increasing how often they change prices as inflation rises, though Montag and Villar (2022) found little empirical evidence for this channel during the pandemic. In addition, a steeper Phillips curve could reflect that labor supply is less responsive to higher wages, which may have arisen from the lingering effects of pandemic-related health concerns on labor force attachment. Therefore, higher wages, particularly in sectors that were more exposed to the pandemic such as leisure and hospitality, may have induced a more muted labor supply increase in 2021 than in the past.
Because state-level inflation data are currently only available until 2021, we do not know whether supercore inflation is still as sensitive to labor market tightness as it was during the early recovery from the pandemic. A continuation of this increased sensitivity would mean that inflation could fall significantly with only moderate labor market softening. However, an important upside risk to inflation is that this sensitivity to labor markets could drop back to its pre-pandemic values. For instance, labor supply may become more sensitive to wages as health risks continue to abate.
Conclusion
Using state-level data, this Letter shows that, while services inflation is significantly linked to labor market conditions, this relationship is largely due to rent inflation. In contrast, we found only a weak relationship for supercore inflation, which removes housing services. Still, supercore inflation responded more strongly to unemployment rates early in the recovery from the pandemic, possibly due to health concerns that reduced the responsiveness of labor supply to wage increases. If this increased sensitivity continues, supercore inflation could help reduce inflation significantly with only moderate aggregate demand and labor market softening. However, if supercore inflation returns to its lower pre-pandemic sensitivity, reducing supercore inflation may require a more pronounced slowdown in overall demand.
Sylvain Leduc
Executive Vice President and Director of Research, Federal Reserve Bank of San Francisco
Daniel J. Wilson
Vice President, Economic Research Department, Federal Reserve Bank of San Francisco
Cindy Zhao
Research Associate, Economic Research Department, Federal Reserve Bank of San Francisco
References
Jordà, Òscar, Celeste Liu, Fernanda Nechio, and Fabián Rivera-Reyes. 2022. “Why Is U.S. Inflation Higher than in Other Countries?” FRBSF Economic Letter 2022-07 (March 28).
Lansing, Kevin J., Luiz E. Oliveira, and Adam H. Shapiro. 2022. “Will Rising Rents Push Up Future Inflation?” FRBSF Economic Letter 2022-3 (October 18).
Montag, Hugh, and Daniel Villar. 2022. “Price-Setting During the Covid Era?” Bureau of Labor Statistics Working Papers 547.
Powell, Jerome H. 2022. “Inflation and the Labor Market” Speech at the Hutchins Center on Fiscal and Monetary Policy, Brookings Institution, Washington DC.
Shapiro, Adam H. 2022. “How Much Do Supply and Demand Drive Inflation?” FRBSF Economic Letter 2022-15 (June 21).
Shapiro, Adam H. 2022. “How Much Do Labor Costs Drive Inflation?” FRBSF Economic Letter 2023-13 (May 30).
Graduate Student, Princeton University
Opinions expressed in FRBSF Economic Letter do not necessarily reflect the views of the management of the Federal Reserve Bank of San Francisco or of the Board of Governors of the Federal Reserve System. This publication is edited by Anita Todd and Karen Barnes. Permission to reprint portions of articles or whole articles must be obtained in writing. Please send editorial comments and requests for reprint permission to research.library@sf.frb.org