
Shelter inflation has remained high even as other components of inflation have fallen. However, various market indicators, including house prices and rents, suggest that the housing market has slowed significantly with the rise in interest rates. Forecasting models that combine several measures of local shelter and rent inflation can help explain how recent trends might affect the path of future shelter inflation. The models indicate that shelter inflation is likely to slow significantly over the next 18 months, consistent with the evolving effects of interest rate hikes on housing markets.
House prices and asking rents slowed sharply in 2023 after a period of extraordinary growth starting in early 2020. However, measures of shelter inflation that are tracked as part of the consumer price index (CPI) have continued to grow, even as some other components of overall inflation have cooled. The Federal Reserve has aimed to reduce inflation by raising interest rates sharply since early 2022. If shelter inflation were to persist at current high levels, it could create challenges for the Federal Reserve in reducing overall inflation to its 2% longer-run goal.
In this Economic Letter, we forecast the path of CPI shelter inflation over the next 18 months by combining data from various market indexes that measure shelter inflation and housing markets. Our results suggest that the recent slowdown in asking rents and house prices is likely to slow shelter inflation significantly in the future, although substantial uncertainty surrounds these forecasts.
The unclear relationship between asking rents and shelter inflation
Shelter inflation is playing a significant role in the current high level of overall inflation. Figure 1 plots year-over-year growth in core CPI inflation, which excludes volatile food and energy prices; the gold line includes shelter inflation, while the green line excludes it. The CPI inflation measures generally track the Federal Reserve’s preferred inflation gauge, the personal consumption expenditures price index, albeit with small deviations in the level and timing of changes. The lines show that how much inflation pressures have moderated depends significantly on the impact of shelter inflation, which has been above 8% since early 2023 (blue line). Whether shelter inflation remains high will strongly influence the path of future overall inflation because shelter makes up about 30% of the CPI consumption basket.
Figure 1
The role of shelter inflation in overall inflation
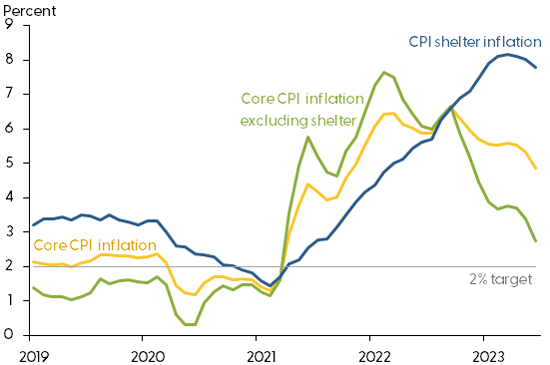
Source: Bureau of Labor Statistics via Haver Analytics.
The CPI shelter inflation index is designed to measure changes in consumer spending on the entire stock of housing services. Therefore, the index includes households who have just moved and are paying the prevailing asking rent, as well as households who have not moved recently and are paying different rent amounts. Persistent shifts in asking rents are gradually incorporated into the stock of total rents as households move or landlords update leases. As a result, indexes of asking rents can provide insights about the future path of shelter inflation (Adams et al. 2022).
However, how specific asking-rent indexes are accounted for in the CPI shelter inflation is complicated by differences in building types and geographic areas, as well as differences in methodologies used to estimate rents. Specific asking-rent indexes do not necessarily represent the overall market, which means changes in these indexes might not translate one-for-one into changes in the CPI shelter index, even with a lag. For example, an index that weights suburban rents more than the CPI index does will diverge from the CPI index to the extent that suburban rents diverge from the average rent.
Figure 2 plots several indexes of asking rents and house prices along with CPI shelter inflation, which we normalize to 100 in January 2020 for ease of comparison. The wide range of results illustrates the difficulty in understanding how these indexes translate into the CPI shelter index (dark blue line). The figure shows that, as asking rents and house prices increased, the shelter index also eventually increased. But a significant gap remains between the spot-market indexes and CPI shelter. If we assume that these indexes should eventually converge, the figure implies that the shelter price index would need to rise much further or that asking rents would need to decline further. But these level differences could also mean the underlying construction of the indexes vary significantly, such that their results need not fully agree.
Figure 2
Shelter inflation and market indexes
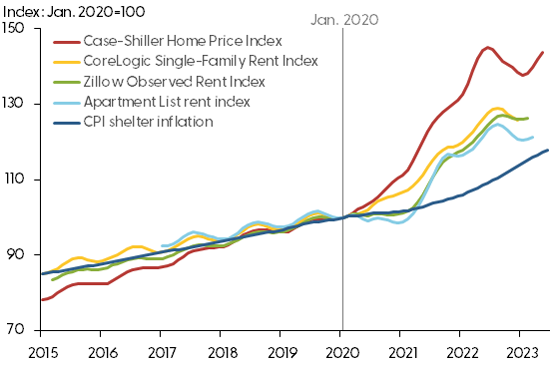
Source: Apartment List, CoreLogic, S&P/Case-Shiller via FRED, and Zillow.
Shelter inflation is likely to slow
It is difficult to extrapolate the path of shelter inflation directly from asking-rent indexes, although theory and past data suggest that they should be connected. In fact, recent research has demonstrated that asking rents can be quite informative for forecasting the path of shelter inflation (Lansing, Oliveira, and Shapiro 2022 and Cotton and O’Shea 2023).
We follow this approach and develop a dynamic statistical model (Jordà 2005) to forecast cumulative core-based statistical area (CBSA) shelter inflation over the next 18 months. CBSAs are cities and surrounding communities that can provide a useful economic unit for thinking about housing markets. This framework allows us to take a flexible approach to estimating the relationships between housing market indicators and shelter inflation. In our model, we evaluate how well we can predict the evolving cost of shelter based on monthly data for lagged year-over-year growth from the Zillow Home Value Index, Zillow Observed Rent index, Apartment List National Rent Index, Apartment List Vacancy Index, CoreLogic Single-Family Rent Index, S&P/Case-Shiller U.S. National Home Price Index, and past CPI shelter inflation. Specifically, our outcome is cumulative shelter inflation, or the total growth in the price level over some period. We then convert our forecast into year-over-year shelter inflation rates. Our sample covers the period from March 2018 to April 2023.
This disaggregated approach using CBSA-level data can potentially provide more statistical precision than an aggregate model of shelter inflation. Many of the housing market indicators we use do not have long histories, which limits the precision of any aggregate model. However, despite the short data period, using a wide range of housing market indicators and shelter inflation across 18 CBSAs increases our statistical power. We then aggregate our CBSA-level forecasts of shelter inflation to form an estimate of aggregate shelter inflation using CBSA population weights.
We evaluate the accuracy of potential forecasting models based on their cumulative out-of-sample forecast error using rolling estimates from February 2020 onward. Specifically, we estimate our model using all the data before February 2020; we then produce a forecast for the next 18 months and compare the results against actual data on shelter inflation to measure the model’s forecast error. We next move our sample forward one month, reestimate the model, and calculate the forecast errors again. Finally, we select the model with the smallest forecast errors on average across all horizons and estimate this model on the entire sample.
The dashed line in Figure 3 presents our baseline forecast of year-over-year shelter inflation over the next 18 months based on the average of cumulative shelter inflation forecasts at the CBSA level. Blue shading shows the area in which 95% of the model’s out-of-sample forecast errors fall, indicating the range of confidence regarding the accuracy of our model estimates. The solid line plots actual year-over-year shelter inflation.
Figure 3
Forecast of year-over-year shelter inflation: Full model
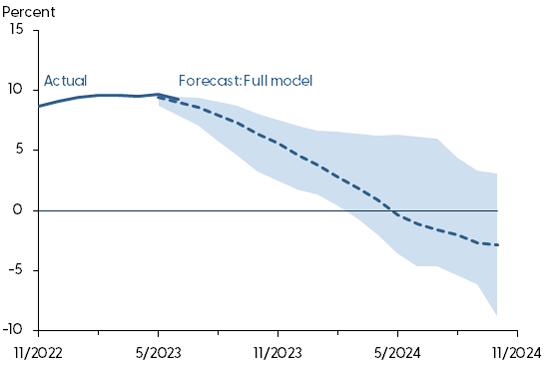
Note: Solid line shows actual year-over-year changes; dashed line shows average forecast, with shaded 95% confidence band.
Our baseline forecast suggests that year-over-year shelter inflation will continue to slow through late 2024 and may even turn negative by mid-2024. This would represent a sharp turnaround in shelter inflation, with important implications for the behavior of overall inflation.
The deflationary component of this forecast would be the most severe contraction in shelter inflation since the Global Financial Crisis of 2007-09. Therefore, we assess whether our results are overly sensitive to the recent rapid increases in housing costs. This is important because shelter prices tend to be less flexible in economic slowdowns and hence may not decline as rapidly as they rose. To check this, we drop the index that has the most negative effect on the cumulative forecast—which turns out to be lagged CPI shelter inflation—and then reestimate the model.
This second, limited model is only slightly less accurate in our out-of-sample testing than the baseline model, but Figure 4 illustrates some important differences between the two. The limited model does not forecast a deflationary episode in 2024, although it does suggest that year-over-year shelter inflation will hit zero around summer 2024. Critically, both models agree that shelter inflation is likely to slow significantly over the next 18 months.
Figure 4
Forecast of year-over-year shelter inflation: Limited model
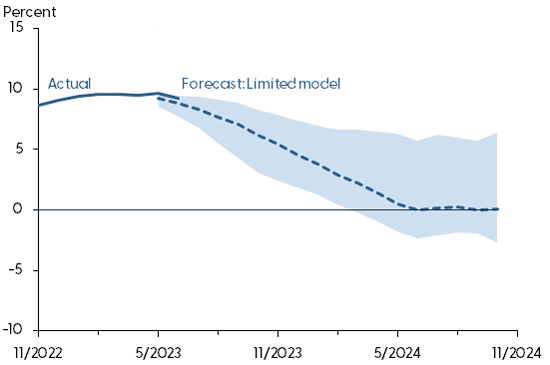
Note: Solid line shows actual year-over-year changes; dashed line shows average forecast, with shaded 95% confidence band.
There are several important caveats to these forecasts. First, the range of possible forecast errors is quite wide, with year-over-year shelter inflation in late 2024 estimated to fall anywhere from about –9% to about 2% in our baseline model, and –2% to 5% in our limited model. This suggests significant uncertainty in the forecasts. However, even the more modest predictions shown by the upper value of the range of estimates would represent a slowdown in shelter inflation.
A second caveat is that these models are estimated primarily on data from the pandemic period, which saw exceptional growth in housing markets and inflation. The relationship between these housing market indicators and shelter inflation could therefore be different going forward. This introduces additional uncertainty for our projections, beyond that reflected in the shaded confidence regions.
Finally, these forecasts do not account for any potential future shocks. So important changes in the economy could cause housing market inflation to accelerate or decelerate, and our forecast cannot predict those changes. Ideally, the distribution of our forecast errors should account for this uncertainty, but that will depend on future shocks being similar to past shocks. Thus, although our forecasts summarize current signals about the path of shelter inflation, many unforeseen factors could affect the actual realizations of shelter inflation over the forecast horizon.
Monetary policy famously operates with “long and variable lags,” and our forecasts imply that this guidance is relevant when looking at housing markets and shelter inflation. In particular, our forecasts suggest that the rapid rise in interest rates since early 2022 is likely to have had a significant effect on slowing housing markets, and this slowdown is likely to continue going forward (Liu and Pepper 2023, Gorea et al. 2023).
Conclusion
As policymakers continue to confront elevated inflation, changes in housing markets suggest pressure from shelter inflation could ease substantially. The forecasts we present in this Economic Letter indicate that future shelter inflation may decline considerably, reflecting the signals of slowing in recent rental markets. At a minimum, our results imply that the risk of surprise increases in shelter inflation has become significantly smaller with the rapid rise in interest rates since early 2022.
Augustus Kmetz
Research Associate, Economic Research Department, Federal Reserve Bank of San Francisco
Schuyler Louie
Research Associate, Economic Research Department, Federal Reserve Bank of San Francisco
John Mondragon
Research Advisor, Economic Research Department, Federal Reserve Bank of San Francisco
References
Adams, Brian, Lara Loewenstein, Hugh Montag, and Randal J. Verbrugge. 2022. “Disentangling Rent Index Differences: Data, Methods, and Scope.” FRB Cleveland Working Paper 22-38.
Cotton, Christopher, and John O’Shea. 2023. “Forecasting CPI Shelter under Falling Market-Rent Growth.” FRB Boston Current Policy Perspectives Working Paper 95664.
Gorea, Denis, Augustus Kmetz, Oleksiy Kryvtsov, Marianna Kudlyak, and Mitchell Ochse. 2023. “House Prices Respond Promptly to Monetary Policy Surprises.” FRBSF Economic Letter 2023-09 (March 27).
Jordà, Òscar. 2005. “Estimation and Inference of Impulse Responses by Local Projections.” American Economic Review 95(1, March), pp. 161–182.
Lansing, Kevin J., Luiz E. Oliveira, and Adam Hale Shapiro. 2022. “Will Rising Rents Push Up Future Inflation?” FRBSF Economic Letter 2022-03 (February 14).
Liu, Zheng, and Mollie Pepper. 2023. “Can Monetary Policy Tame Rent Inflation?” FRBSF Economic Letter 2023-04 (February 13).
Opinions expressed in FRBSF Economic Letter do not necessarily reflect the views of the management of the Federal Reserve Bank of San Francisco or of the Board of Governors of the Federal Reserve System. This publication is edited by Anita Todd and Karen Barnes. Permission to reprint portions of articles or whole articles must be obtained in writing. Please send editorial comments and requests for reprint permission to research.library@sf.frb.org