

Businesses faced challenges finding enough workers to fill job openings early in the pandemic recovery. One view suggests that, as economic growth moderated relative to the strong bounceback in economic activity in the early pandemic recovery period, some businesses started hoarding labor to avoid the potential difficulty of recruiting workers in the future. Evidence from Okun’s law—which theorizes that economic output tends to fall as unemployment rises—is consistent with this view. The results suggest that businesses partly adjusted production by changing the number of hours for current workers rather than varying employee numbers.
Growth has generally slowed since the strong bounceback in economic activity observed in the early pandemic recovery period from mid-2020 through 2021—and policymakers and professional forecasters expect further moderation in 2024 following a robust third quarter in 2023. In many recent surveys, businesses have indicated a reluctance to let go of workers in the face of weaker growth, fearing difficulties if they need to rehire, a practice often called “labor hoarding.”
To examine the possibility that labor hoarding is playing a role in labor markets, this Economic Letter uses Okun’s law, a rule of thumb that links output growth to changes in the unemployment rate. Following the initial pandemic shock, the link between economic growth and the unemployment rate has been more muted than would be predicted from Okun’s law alone. As the pandemic abated and growth quickly increased starting in mid-2020, the unemployment rate initially fell less than predicted by Okun’s law, which likely reflected hiring difficulties at the time. Similarly, as economic growth has generally moderated relative to earlier in the pandemic recovery, the unemployment rate has risen much less than implied by Okun’s law, consistent with a rise in labor hoarding.
Our findings align with the increases and declines in hours worked in response to varying demand for goods and services in the wake of the pandemic. As growth picked up, businesses sidestepped their hiring challenges and adjusted production by increasing the number of hours worked by employees already on the payroll. In turn, as demand generally moderated relative to the strong early recovery period, businesses reduced the number of hours worked instead of laying off employees.
Okun’s law over the years
In 1962, economist Arthur Okun presented evidence linking the growth rate of the economy to the change in the unemployment rate. This relationship became known as Okun’s law because of its enduring stability over the years following the publication of the result. We estimate this relationship for the period between 1949 and 2023, using the four-quarter growth rate of the average between inflation-adjusted, or real, gross domestic product (GDP) and real gross domestic income (GDI). Combining information between real GDP and real GDI has been shown to provide a more precise growth measure (see Aruoba et al. 2016).
Over that nearly 75-year period, our estimates indicate that a 1 percentage point increase in the unemployment rate is associated with a 1.5 percentage point decline in economic growth (Figure 1). In the figure, every point reflects the combination of growth and the change in the unemployment rate in a particular quarter, while the blue line represents the strength of the relationship between growth and changes in the unemployment rate. The negative slope of the blue line indicates that lower growth is associated with more unemployment.
Figure 1
Okun’s law relationship between growth, unemployment
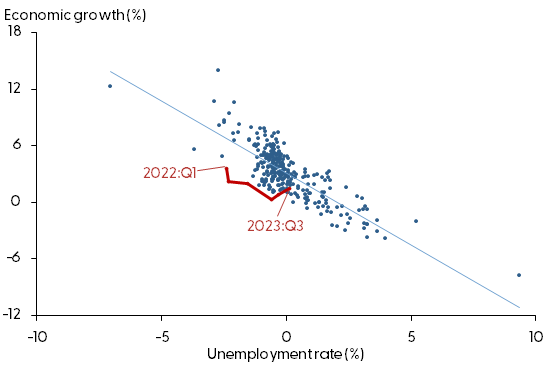
Note: Okun’s law is represented via the difference method, using a linear regression (blue line) of the four-quarter change in the average of real GDP and real GDI on the four-quarter change in the unemployment rate. Data points from 2022:Q1 onward are chronologically linked in red.
From a general perspective, the relationship is intuitive. It says that an economy can grow and produce more goods and services when more people are employed. But the size of the estimated relationship may be somewhat surprising, since labor accounts for only about two-thirds of output. In contrast, our estimates suggest that variations in the number of employed workers is associated with 1.5 times as large an impact on output growth.
Firms have other ways to increase production that can accompany variations in the number of employed workers. For instance, they can increase the number of worker hours for current employees. Alternatively, businesses may seek to boost labor productivity, so that more goods and services can be produced with the same number of workers. Okun’s law indirectly captures these other channels of adjustments that boost the strength of the relationship between growth and changes in the unemployment rate. As long as the connections of all these variables to output growth stay constant over time, Okun’s law should remain the same.
Hiring difficulties and labor hoarding
Figure 1 also highlights the growth rates and changes in the unemployment rate in recent quarters (red dots and line). As growth moderated relative to the strong early recovery period, the unemployment rate continued to decline while Okun’s law would have suggested some increase, with the red line consistently lying to the left of the regression estimate shown by the blue line. In other words, the labor market remained relatively strong even as growth moderated relative to the early recovery period, possibly because businesses decided to avoid layoffs in favor of hoarding labor.
Alternatively, the signal from Okun’s law could be misleading because the economy has changed a lot since the 1950s (Knotek 2007). To explore this possibility, we estimate Okun’s law over shorter 20-year data samples.
Figure 2 shows that Okun’s law was indeed very stable during the 1960s and 1970s, with the relationship implying that a 1 percentage point increase in the unemployment rate is associated with an increase in the growth rate of about 2 percentage points. This stability gradually broadened the law’s popularity among economists and policymakers. But over time the estimated slope measure has declined. Over the past 20 years, a 1 percentage point increase in the unemployment rate has been associated with about a 1.1 percentage point decline in growth. In other words, the strength of the relationship between these variables has roughly halved in more recent data.
Figure 2
Okun’s law relationship has weakened in recent decades
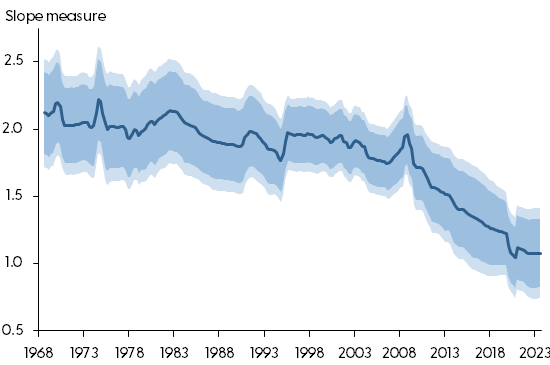
Note: Okun’s law is represented via the difference method, using a 20-year rolling linear regression of the four-quarter change in the average of real GDP and real GDI on the four-quarter change in the unemployment rate. The regression’s slope measure is shown in absolute terms (solid blue line), with confidence shading of 95% (darker blue) and 99% (lighter blue).
To examine the view that businesses started hoarding labor following the early pandemic recovery period, we focus on estimates of Okun’s law over the 20 years before the onset of the COVID-19 pandemic. We then combine these estimates with the actual growth rates since the start of the pandemic to back out the implied changes in the unemployment rate. Starting from the first quarter of 2020, we can then construct the level of the unemployment rate consistent with Okun’s law. We report this series in Figure 3 along with the actual unemployment rates.
Figure 3
Actual unemployment rate versus Okun’s law implied rate
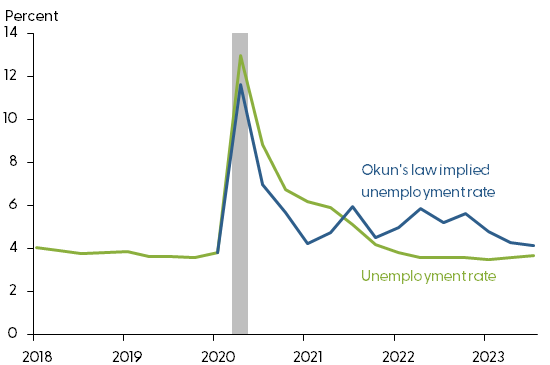
Note: The Okun’s law implied unemployment rate is based on the difference method, using a 20-year rolling linear regression of the four-quarter change in the average of real GDP and real GDI on the four-quarter change in the unemployment rate through 2019:Q4. Gray shading indicates NBER recession dates.
The figure highlights that, as the economy started to recover from the depth of the pandemic in mid-2020, the actual unemployment rate was consistently above the rate implied by Okun’s law. According to Okun’s law, the strong output growth during this part of the recovery should have led to a greater decline in the unemployment rate relative to what was actually experienced. In contrast, starting as early as mid-2021, the actual unemployment rate has been consistently lower than the rate implied by Okun’s law. As economic growth moderated over this period relative to earlier in the recovery, Okun’s law would have predicted a rise in the unemployment rate to roughly 5% on average. Instead, the quarterly jobless rate remained generally constant at around 3.7%. As of late, the unemployment rate implied by Okun’s law has come down closer to, but remained above, actual unemployment rate readings.
These departures from Okun’s law since the recovery from the pandemic are in line with businesses’ perspectives of the labor market during that period. For example, the National Summary section of the Beige Book began reporting on firm’s “challenges in bringing employees back to work” as early as May 2020 (Federal Reserve Board of Governors 2020). In 2021, 59% of small firms seeking to hire workers said that hiring was very difficult; this reached as high as 69% for firms within the leisure and hospitality sector (Federal Reserve System 2022). Overall, during the early phase of the recovery, firms reported facing difficulties recruiting workers, possibly because workers remained fearful of the virus or because generous pandemic fiscal transfers led to a substantial increase in “excess” savings, as documented by Abdelrahman and Oliveira (2023), which made it likely easier to delay a return to work. In contrast, as economic growth moderated relative to the early pandemic recovery period, firms may have been reluctant to lay off workers out of a fear that it would be difficult to rehire staff if the relative slowdown proved shallower or shorter than expected. Thus, the uncertainty about future growth and hiring abilities may have led firms to hoard labor, keeping the actual unemployment rate lower than would be implied by Okun’s law. Again, a possible alternative explanation is that Okun’s law could have simply continued to weaken following the pandemic.
If businesses did not rely on changes in employee numbers, how did they adjust production as growth surged in the early phase of the recovery and slowed thereafter? One way they adjusted production was by varying the number of hours for workers already on their payrolls. As Figure 4 shows, average weekly hours initially increased as the economy bounced back from the pandemic before declining back to their pre-COVID level by early 2023.
Figure 4
Changes in average weekly hours for workers
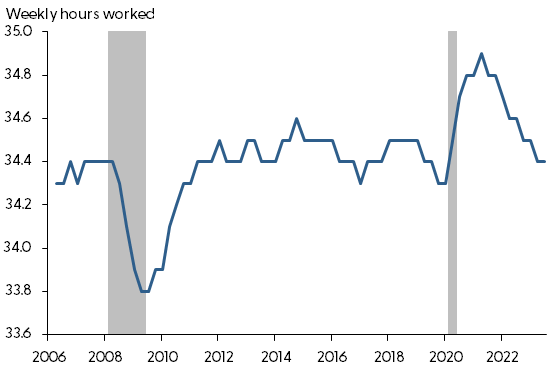
Note: Average weekly hours worked in total private industries shown as quarterly averages. Gray shading indicates NBER recession dates.
If labor hoarding is indeed at play, another question to consider is whether this phenomenon is expected to continue going forward. The median forecast from the Federal Open Market Committee’s latest Summary of Economic Projections (SEP) forecasts a peak unemployment rate of 4.1% (Federal Reserve Board of Governors 2023). Extending our analysis further into the SEP’s forecast horizon shows that the Okun’s law instead implies an unemployment rate peak of 4.5%. While several factors may be at play, this difference suggests that the idea of labor hoarding is in line with policymakers’ forecasts.
Conclusion
When the economy initially recovered from the pandemic, firms reported significant hiring difficulties. As growth moderated relative to the strong early recovery period, businesses also reported a reluctance to lay off workers, fearing future hiring challenges. In this Letter, we show that the predictions from Okun’s law are consistent with these perspectives. The actual unemployment rate was higher than the unemployment rate implied by Okun’s law in the initial part of the recovery, as hiring challenges made it difficult to recruit staff. In contrast, the unemployment rate remained lower than implied by Okun’s law after the early recovery period, as economic growth moderated comparatively. To help adjust production—and possibly in lieu of laying off workers—businesses varied the hours of workers already on their payroll.
References
Abdelrahman, Hamza, and Luiz E. Oliveira. 2023. “The Rise and Fall of Pandemic Excess Savings.” FRBSF Economic Letter 2023-11 (May 8).
Aruoba, S. Borağan, Francis X. Diebold, Jeremy Nalewaik, Frank Schorfheide, and Dongho Song. 2016. “Improving GDP Measurement: A Measurement-Error Perspective.” Journal of Econometrics 191(2), pp. 384–397.
Federal Reserve Board of Governors. 2020. “Beige Book, May 27, 2020.”
Federal Reserve Board of Governors. 2023. “Summary of Economic Projections.” Federal Open Market Committee, December 13.
Federal Reserve System. 2022. Small Business Credit Survey: 2022 Report on Hiring and Worker Retention. FED Small Business website.
Knotek, Edward S. II. 2007. “How Useful Is Okun’s Law?” FRB Kansas City Economic Review (Fourth Quarter).
Opinions expressed in FRBSF Economic Letter do not necessarily reflect the views of the management of the Federal Reserve Bank of San Francisco or of the Board of Governors of the Federal Reserve System. This publication is edited by Anita Todd and Karen Barnes. Permission to reprint portions of articles or whole articles must be obtained in writing. Please send editorial comments and requests for reprint permission to research.library@sf.frb.org