


U.S. households accumulated significantly more wealth following the pandemic onset than would have been expected without the pandemic shock. Overall excess household wealth—measured as households’ inflation-adjusted net worth beyond pre-pandemic projections—peaked in late 2021 at $13 trillion, then rapidly fell to zero in late 2022, where it broadly remained through the third quarter of 2023. This rise and fall can be attributed mainly to financial assets, particularly equity holdings. Similarly, real liquid asset holdings currently sit below pre-pandemic projections despite a persistent rise in checking account balances.
Consumer spending has remained strong over the past two years despite increasingly restrictive monetary policy. The continued strength in spending has been partially supported by the large buildup of pandemic-era excess household savings—defined as the amount of savings above what could be expected in the absence of the pandemic shock. Excess savings remains an important determinant of future spending and overall economic growth.
Recent studies have focused on personal savings as measured by the difference between personal income and personal consumption flows in the National Income and Product Accounts (NIPA) data from the Bureau of Economic Analysis (Aladangady et al. 2022 and Abdelrahman and Oliveira 2023). Other studies have focused on even narrower types of savings, such as stimulus checks (Armantier et al. 2021) and checking account balances (Wheat and Deadman 2023).
In this Economic Letter, we take a broader perspective by examining household wealth. Unlike savings measures, a wealth measure accounts for both liquid assets and illiquid assets, including the unrealized capital gains on those assets. This broader definition provides a more comprehensive picture of the financial health of U.S. households that complements the NIPA-based flow measure of excess savings. However, this expanded perspective comes with the caveat of a less clear link with consumer spending. Specifically, it is harder to fund consumption from illiquid assets, such as real estate, than with cash or other more liquid assets.
We construct excess wealth measures that quantify how various household balance sheet components compare with “no-pandemic” scenarios. These scenarios are balance sheet projections made at the fourth quarter of 2019–just before the onset of the pandemic recession. Since they are based on pre-pandemic information, the projections exemplify what household wealth would have been in the absence of the pandemic shock. We focus on real measures of excess wealth, that is, wealth adjusted for inflation. We find that real excess wealth peaked in late 2021 before declining rapidly to its pre-pandemic expected level in late 2022, where it broadly remained through the third quarter of 2023. We attribute this trajectory mainly to the dynamics of financial assets, in particular equity holdings, but also to higher inflation, which reduced the real value of all assets. Real liquid assets show a path similar to overall net worth, where a significant decline in savings and time deposits noticeably offset a persistent increase in checking account balances.
Household balance sheet changes in the pandemic period
The broadest measure of overall household wealth is net worth, defined as the difference between total assets and total liabilities. Total household assets can be separated into financial assets and nonfinancial assets. Financial assets include holdings such as checkable deposits, saving deposits, corporate and noncorporate equity, and pension entitlements. Nonfinancial assets are mainly real estate holdings but can also include intellectual property, equipment, and vehicles. Lastly, household liabilities are primarily composed of residential mortgages and consumer credit, along with other types of household debt.
Figure 1 shows how real household wealth, or net worth, has evolved in recent years according to data from the Financial Accounts released by the Federal Reserve Board of Governors. In the five years preceding the pandemic, real assets grew 4% per year while real debt grew 2% per year; this resulted in a steady increase in real household net worth (black line) to $112 trillion by late 2019.
Figure 1
Overall real household net worth
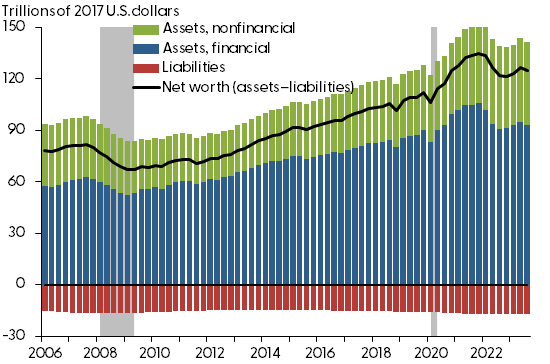
Source: Federal Reserve Board of Governors and authors’ calculations.
Following the onset of the pandemic, households rapidly accumulated assets, in part reflecting lower consumer spending associated with pandemic restrictions. Financial support programs in 2020 and 2021—including direct cash transfers and expanded unemployment insurance—also directly contributed to this accumulation. By the end of 2021, household asset holdings (blue and green bars) had grown by $24 trillion relative to late 2019, while household liabilities (red bars) only increased by $1 trillion. Overall, real household wealth rose by $23 trillion (20%) over those two years, reaching an all-time high level of $135 trillion in 2017 dollars.
Despite a small increase in early 2023, overall household wealth has declined compared with 2021 levels. While real nonfinancial assets and household liabilities remained generally stable in 2022 and 2023, real financial assets fell by 14% in 2022 before recovering some of these losses in early 2023. Much of the decline in financial assets came from reduced equity holdings, but higher inflation also reduced the real value of all assets.
Figure 2 breaks real financial assets into its main components. Assets that are more liquid, meaning generally more accessible and easily turned into cash, are shown in blue tones, while less liquid assets are shown in green tones. Household equity holdings (dark green) make up about half of overall financial holdings and include corporate and noncorporate equities as well as mutual fund holdings. These declined noticeably through 2022, likely as a result of weak stock market performance and a decrease in corporate equity valuations.
Figure 2
Overall real household financial assets
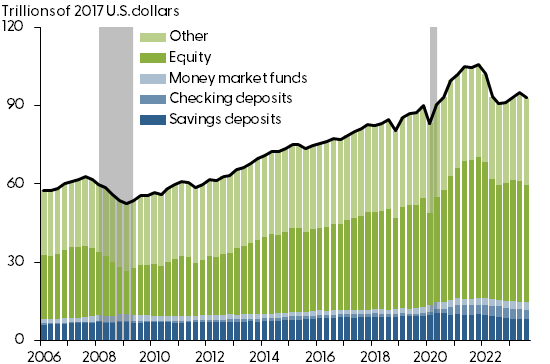
Source: Federal Reserve Board of Governors and authors’ calculations.
The amount that households hold in their checking accounts (medium blue bars) represents a very small fraction of overall financial holdings; however, that amount more than tripled after the onset of the pandemic recession. This unprecedented spike in checkable deposits does not fully account for the changes in households’ liquid holdings, as the increase has been noticeably offset by a decrease in savings and time deposits (dark blue bars). In fact, the combined value of checking and saving deposits as a share of overall financial assets was unchanged from its pre-pandemic share by the third quarter of 2023.
Real net worth in excess of a no-pandemic scenario
We construct a measure of excess wealth by comparing current balance sheet components to a “no-pandemic” scenario projection. The projection is designed to capture how household balance sheets would have evolved without the pandemic shock, removing both pandemic-era policy interventions and changes to how households use and store their wealth. We construct this scenario using the local projections method of Jordà (2005). The projection is preferred to a simple linear trend because it can capture a combination of nonlinear macroeconomic, financial, and demographic trends. The methodology also allows us to construct statistical confidence bands around our projections. We estimate an out-of-sample projection by using data only up to the fourth quarter of 2019—just before the onset of the pandemic recession in the first quarter of 2020.
Our results in Figure 3 show that overall real household wealth has returned to its expected pre-pandemic projection. Real net worth (blue solid line) peaked in the last quarter of 2021 at about $13 trillion higher than the projected path (blue dashed line). Since then, net worth has decreased rapidly towards its projected path. As of the third quarter of 2023, household wealth was close to its expected pre-pandemic projection.
Figure 3
Overall real household wealth with local projections
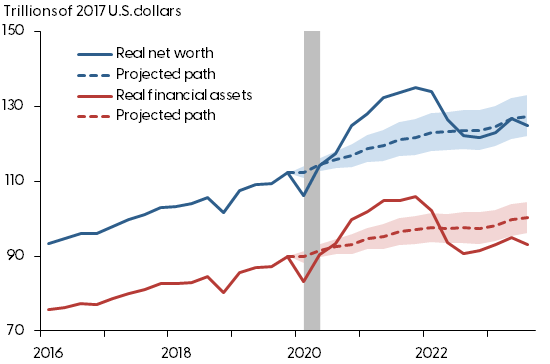
Source: Federal Reserve Board of Governors and authors’ calculations.
Repeating this analysis to focus on financial assets (red line), we find that household real financial asset holdings peaked at $10 trillion above their projected path in mid-2021 before returning to the projected trend in mid-2022. Since then, the decline in financial assets to about $7.3 trillion below the projected path has been mainly attributable to lower equity holdings, which decreased by 17% in 2022.
In Figure 4, we focus on liquid financial assets, which can more readily fund spending. Much like overall financial assets, real liquid assets (blue line) peaked in late 2021 and then started to fall below projected levels in 2022. Within liquid assets, checking account balances (red line) substantially increased following the pandemic. However, the sharp increase was noticeably offset by a significant decline in savings and time deposits (green line) that began in late 2020 and dropped well below projected levels. This decline in savings and time deposits is surprising given the contemporaneous sharp increase in interest rates. Despite a higher interest-rate incentive, it appears that households continuously shifted assets from their savings accounts into their checking accounts to fund spending.
Figure 4
Overall real liquid household wealth
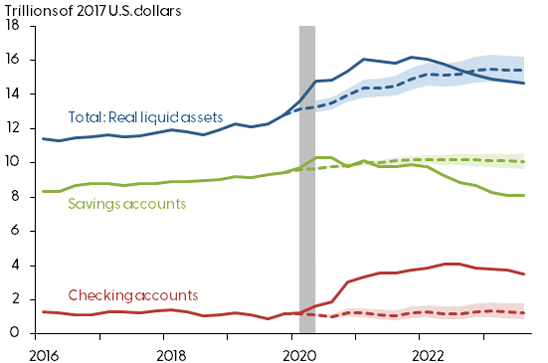
Source: Federal Reserve Board of Governors and authors’ calculations.
Conclusion
In this Letter, we examine the post-pandemic dynamics of household balance sheets and find a large increase and subsequent decline in real excess wealth. Household asset holdings and overall wealth expanded rapidly in the two years following the onset of the pandemic recession. However, subsequent declines in equity holdings and drawdowns from savings deposits resulted in real household wealth coming back down to levels close to what could have been expected in the absence of the pandemic recession. The measured peak of $13 trillion in real excess wealth likely helps explain the strong momentum in consumer spending since the onset of the pandemic recession.
The most recent data as of the third quarter of 2023 show that real excess wealth, including excess liquid assets, is no longer positive. We see two takeaways about the risks going forward. On the one hand, the overall level of real household wealth remains above levels observed just before the onset of the pandemic, which could signal continued strength in spending out of wealth going forward. Gains in equity markets since late 2023 may reinforce this strength. On the other hand, liquid assets, which more readily fund spending, have been diminishing and are approaching levels significantly lower than the projected pre-pandemic path. As these excess liquid funds run out, consumers may decide to pull back on spending.
References
Aladangady, Aditya, David Cho, Laura Feiveson, and Eugenio Pinto. 2022. “Excess Savings during the COVID-19 Pandemic.” Federal Reserve Board of Governors FEDS Notes. October 21.
Abdelrahman, Hamza, and Luiz E. Oliveira. 2023. “The Rise and Fall of Pandemic Excess Savings.” FRBSF Economic Letter 2023-11 (May 8).
Armantier, Olivier, Leo Goldman, Gizem Koşar, and Wilbert van der Klaauw. 2021. “An Update on How Households Are Using Stimulus Checks.” Liberty Street Economics, FRB New York, April 7.
Jordà, Òscar. 2005. “Estimation and Inference of Impulse Responses by Local Projections.” American Economic Review, 95(1), pp. 161–182.
Wheat, Chris, and Erica Deadman. 2023. “Household Pulse: Balances through March 2023.” Report. JPMorgan Chase Institute, July.
Opinions expressed in FRBSF Economic Letter do not necessarily reflect the views of the management of the Federal Reserve Bank of San Francisco or of the Board of Governors of the Federal Reserve System. This publication is edited by Anita Todd and Karen Barnes. Permission to reprint portions of articles or whole articles must be obtained in writing. Please send editorial comments and requests for reprint permission to research.library@sf.frb.org