
With inflation still above the Federal Reserve’s 2% objective, there is renewed interest in understanding how quickly federal funds rate hikes typically affect inflation. Beyond monetary policy’s well-known lagged effect on the economy overall, new analysis highlights that not all prices respond with the same strength or speed. Results suggest that inflation for the most responsive categories of goods and services has come down substantially from recent highs, likely due in part to more restrictive monetary policy. As a result, the contributions of these categories to overall inflation have fallen.
Monetary policy affects inflation with a lag. This means that, although interest rates react quickly when the Federal Reserve raises the federal funds rate, the effects on inflation are slower and indirect. Higher interest rates increase borrowing costs, slowing investment and overall demand, which ultimately eases the pressure on prices. Understanding the timing and strength of this mechanism is key for policymakers.
Many researchers have estimated the speed and strength of the economy’s response to monetary policy, notably Romer and Romer (2004). The focus is typically a broader measure of inflation, such as headline or core, which reflects an average across many goods and services. However, not all prices of the component goods and services react to monetary policy in the same way. For example, food and energy prices, which are excluded from core but included in headline inflation, often move more in response to global market fluctuations, such as changes in international oil prices, rather than to changes in domestic monetary policy.
In this Economic Letter, we estimate how prices of different goods and services respond to changes in the federal funds rate and use those estimates to build a monetary policy-responsive inflation index. We find substantial variation in how prices react to monetary policy, which suggests that understanding the makeup of overall inflation can provide insights into the transmission of monetary policy to inflation. The extent to which categories that are more responsive to the federal funds rate contribute to inflation affects how much slowing in economic activity is needed to reduce overall inflation. Our analysis indicates that recent ups and downs of inflation have been focused in categories that are most sensitive to monetary policy. Inflation rates for the most sensitive categories—and their contributions to headline inflation—rose from the first half of 2020 through mid-2022, reaching a higher peak than headline inflation, and then began to decline. The inflation rate for this most responsive group of goods and services categories is now close to its pre-2020 rate. Our findings suggest that the Fed’s rate hikes that began in March 2022 are exerting downward pressure on prices and will continue to do so in the near term. Our estimated lags are consistent with the view that the full effects of past policy tightening are still working their way through the economy.
Measuring how prices react to monetary policy
To understand which goods and services are most responsive to monetary policy, we need to determine how their prices react to changes in the federal funds rate, the Federal Reserve’s main policy rate. Because the Federal Reserve adjusts the federal funds rate target in response to macroeconomic developments, including inflation, we use a transformation of the federal funds rate in our estimation. This transformed series, developed by Romer and Romer (2004) and updated by Wieland and Yang (2020), captures the differences between Federal Reserve staff forecasts and the chosen target rate, leaving only policy shocks, or movements in the federal funds rate that are not driven by actual or anticipated changes in economic conditions. We use this series as a so-called instrument for the federal funds rate, such that our results can account for how the federal funds rate itself, rather than its transformation, affects inflation.
We use an approach developed by Jordà (2005) that compares two forecasts—with and without rate shocks—to estimate how the federal funds rate affects price movements over time. Specifically, we estimate the relationship between the federal funds rate and the cumulative percent change in prices, controlling for recent trends in the federal funds rate, inflation, and economic activity. Repeating this estimation over multiple horizons produces a forecast comparison, or impulse response function, that gives us an estimate of the expected percent change in prices following a rate increase. For example, applying this method to the headline personal consumption expenditures (PCE) price index indicates that four years after a 1 percentage point increase in the federal funds rate, overall prices are typically about 2.5% below what they would have been without the rate increase.
Creating a policy-responsive inflation index
We estimate impulse response functions separately for the 136 goods and services categories that collectively make up headline PCE inflation. Figure 1 shows examples of the largest cumulative percent price declines over a four-year period in response to a 1 percentage point increase in the federal funds rate. The goods and services categories selected as examples account for large shares of total expenditures in headline PCE inflation. We also include one example of the few categories where prices do not decline, higher education, shown as a small positive value.
Figure 1
Reaction to a policy rate increase: Selected PCE categories
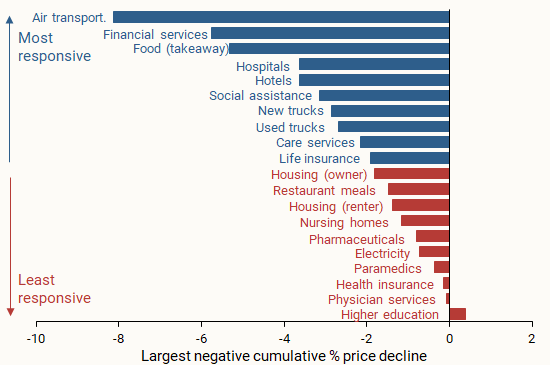
Source: Bureau of Economic Analysis and authors’ calculations.
The takeaway from Figure 1 is that headline PCE inflation is made up of categories that differ in their responsiveness to increases in the federal funds rate. Some respond more strongly, such as those with larger typical cumulative price declines, while others respond less strongly, such as those with smaller typical price declines. Focusing on the most responsive categories can shed light on how monetary policy has influenced the path of inflation over the post-pandemic period. We use our results to divide the categories into two groups of goods and services. The most responsive group (blue bars) contains goods and services whose largest cumulative percent price decline over a four-year window is in the top 50% of all such declines. The least responsive group (red bars) contains goods and services in the bottom 50%.
Following the methods in Shapiro (2022), we use these two groups, along with the share of total expenditures for each good or service, to create two new aggregate PCE inflation measures. Figure 2 shows their 12-month percent changes over time. The blue shading marks the period from mid-2019 until early 2020 when the Federal Reserve lowered the federal funds rate. The vertical yellow line marks the start of the most recent tightening cycle in March 2022. Inflation in the most responsive categories (blue line) is more volatile than overall headline PCE inflation (green line) from the Bureau of Economic Analysis (BEA), and inflation in the least responsive categories is less volatile (red line).
Figure 2
Most and least responsive inflation rates
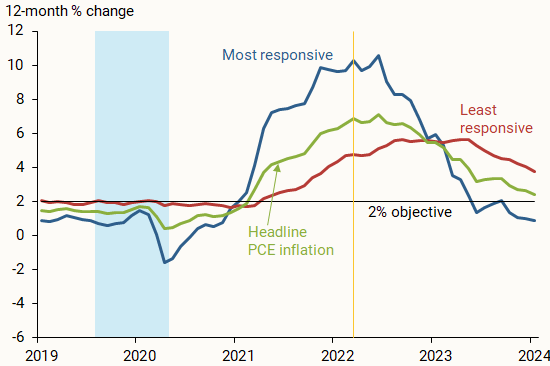
Source: Bureau of Economic Analysis and authors’ calculations.
After the start of the 2020 recession, inflation rates for both categories rose but have since come down from their recent peaks. This pattern is particularly pronounced for the most responsive inflation group, for which inflation peaked at 10.5% in mid-2022 and has fallen to 0.9% as of January 2024; this is just under its average of 1% from 2012, when the Federal Reserve officially adopted a numerical inflation objective, to 2019. Inflation in the least responsive group peaked later, in early 2023, and has fallen only slightly to 3.8% as of January 2024; it remains well above its 2012–2019 average of 1.8%.
How does policy-responsive inflation react to rate increases?
The inflation rates of categories in the most and least responsive groups can move for reasons beyond changes in the federal funds rate, such as global or national macroeconomic developments. To assess the specific role of policy rate increases, we use the methodology described earlier to estimate how the most and least responsive inflation groups tend to react to rate hikes.
The results in Figure 3 suggest that an increase in the federal funds rate typically starts exerting downward pressure on the most responsive prices after about 18 months, when the line showing the impulse response function falls below zero. Month-to-month price changes start falling after a little over a year, depicted when the slope drops below zero and stays negative. This is quicker than the response of overall headline prices from the BEA (not shown), which becomes negative after a little over 24 months and shows month-to-month declines after about 18 months.
Figure 3
Reaction of most and least responsive prices to rate hikes
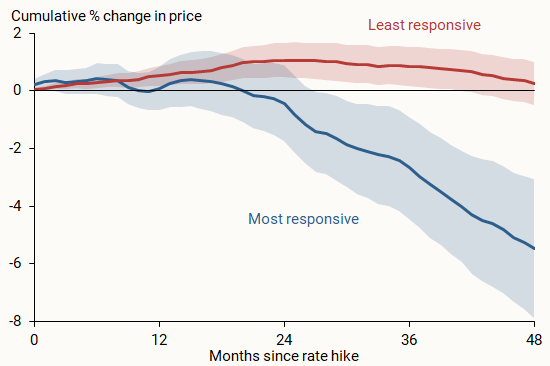
Source: Bureau of Economic Analysis and authors’ calculations.
Because we grouped inflation categories based on the size of their response, there is not necessarily a tie-in to the speed of each categories’ change. However, our results suggest that looking at the most responsive goods and services may also be a useful way of assessing how quickly monetary policy affects inflation.
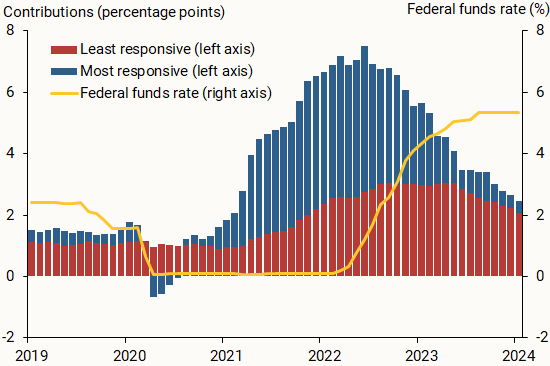
Applying the typical impact timing of the most responsive group of goods and services to the most recent tightening cycle, shown by the federal funds rate line in Figure 4, leads to several conclusions. First, rate cuts from 2019 to early 2020 could have contributed upward price pressures starting in mid- to late 2020 and thus could explain some of the rise in inflation over this period. Second, the tightening cycle that began in March 2022 likely started putting downward pressure on prices in mid-2023 and will continue to do so in the near term. This is consistent with the view that the full effects of monetary policy tightening have yet to be felt. Finally, though inflation for the most responsive categories has been falling since mid-2022, the early part of this decline was likely to have been driven more by changes in prevailing economic conditions than by policy tightening, given estimated policy lags. Some research has considered whether policy lags have shortened (see, for example, Doh and Foerster 2021); however, because inflation began falling mere months after the first rate hike, the drop in inflation may have been too soon to be caused by policy action.
Figure 4
Headline inflation contributions and the federal funds rate
Conclusion
Our findings in this Letter are useful for broadening our understanding of how monetary policy affects inflation. For example, if inflation and the contributions to overall headline inflation are high in a set of categories that are more responsive to monetary policy, as was the case in early 2022, then rate hikes during the most recent tightening cycle are likely to continue to reduce inflation due to policy lags. On the other hand, though inflation in the least responsive categories may come down because of other economic forces, less inflation is currently coming from categories that are most responsive to monetary policy, perhaps limiting policy impacts going forward.
References
Doh, Taeyoung, and Andrew T. Foerster. 2022. “Have Lags in Monetary Policy Transmission Shortened?” FRB Kansas City Economic Bulletin (December 21).
Jordà, Òscar. 2005. “Estimation and Inference of Impulse Responses by Local Projections.” American Economic Review 95(1), pp. 161–182.
Romer, Christina, and David Romer. 2004. “A New Measure of Monetary Shocks: Derivation and Implications.” American Economic Review 94(4), pp. 1,055–1,084.
Shapiro, Adam. 2022. “A Simple Framework to Monitor Inflation.” FRB San Francisco Working Paper 2020-29.
Wieland, Johannes, and Mu‐Jeung Yang. 2020. “Financial Dampening.” Journal of Money, Credit and Banking 52(1), pp. 79–113.
Opinions expressed in FRBSF Economic Letter do not necessarily reflect the views of the management of the Federal Reserve Bank of San Francisco or of the Board of Governors of the Federal Reserve System. This publication is edited by Anita Todd and Karen Barnes. Permission to reprint portions of articles or whole articles must be obtained in writing. Please send editorial comments and requests for reprint permission to research.library@sf.frb.org