
Simulations using a Phillips curve-type relationship provide insights into the importance of demand versus supply for inflation over different periods. The decade of low inflation after the Great Recession was driven mainly by supply forces. Given that monetary policy operates to influence demand but not supply, this result helps to account for the persistent undershooting of the Fed’s 2% inflation goal during these years. In contrast, the period of high inflation during the pandemic era was driven mainly by demand forces.
The Phillips curve is a mathematical relationship that seeks to describe the factors that drive inflation movements. Such factors can include demand and supply forces, expected future inflation, and lagged inflation. Changes in demand tend to push inflation and economic activity in the same direction—as when prices rise while the economy is running hot. By contrast, changes in supply tend to push inflation and economic activity in opposite directions—as when an unexpected drop in oil supply raises oil prices and inflation while pushing down economic activity. Based on these ideas, Shapiro (2025) separates personal consumption expenditures (PCE) inflation into its demand-driven and supply-driven components.
This Economic Letter uses these components in an estimated Phillips curve-type relationship to assess the relative contributions of demand and supply to movements in headline PCE inflation. The PCE inflation data run from January 2000 to February 2025—a period with stable long-run inflation expectations and consistent monetary policy responses to the economy. The importance of short-run expected inflation versus lagged inflation in explaining movements in actual inflation indicates how strongly short-run inflation forecasts are anchored, with stronger anchoring implying less weight on lagged inflation (Jørgensen and Lansing 2025).
Using the estimated relationship, I simulate how inflation would have evolved with only demand-driven inflation or only supply-driven inflation while holding the other measure constant and accounting for the responses of short-run expected inflation and lagged inflation to the alternative inflation scenario. Simulations starting in December 2007 imply that supply forces were the main driver of persistently low inflation during the decade following the end of the Great Recession. Given that monetary policy operates to influence demand-driven inflation but not supply-driven inflation, this result helps to account for the persistent undershooting of the Fed’s 2% goal for headline PCE inflation during these years, despite highly accommodative monetary policy. In contrast, demand forces became more important for inflation and dominated the sizable influence of supply forces during the pandemic era, defined as the period from February 2020 onward.
Data used to estimate a Phillips curve-type relationship
Figure 1 shows 12-month headline PCE inflation from the Bureau of Economic Analysis and 1-year-ahead expected inflation from the Philadelphia Fed’s Survey of Professional Forecasters (SPF). I interpolate between the quarterly values from the SPF data to obtain a monthly series. From the end of the Great Recession in June 2009 to the start of the pandemic recession in February 2020, inflation was below the Fed’s 2% goal for 101 out of 129 months, more than three-fourths of the time. Over much of this same period until December 2015, the Federal Reserve held the federal funds rate close to zero. Starting from 1.66% in February 2020, PCE inflation rose to a 40-year high of 7.25% in June 2022 but has since declined substantially. As inflation rose and fell during the pandemic era, so too has 1-year-ahead expected inflation, but to a lesser degree.
Figure 1
PCE inflation and expected inflation
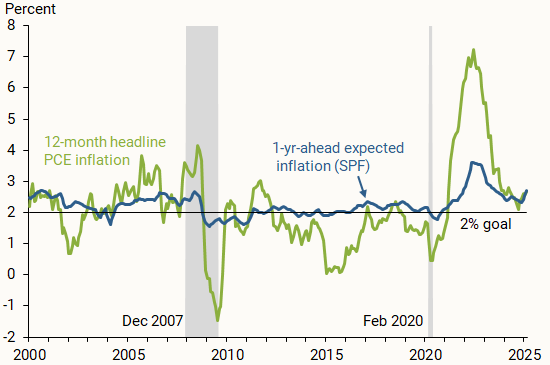
Source: Bureau of Economic Analysis, Philadelphia Fed’s Survey of Professional Forecasters, and author’s calculations.
To gauge the factors driving inflation during different periods, I use the demand-driven and supply-driven components of 12-month PCE inflation constructed by Shapiro (2025). The methodology identifies demand-driven inflation using categories of the PCE basket of goods and services for which the unexpected change in price moves in the same direction as the unexpected change in quantity during a given month. Supply-driven inflation is measured using categories for which the unexpected changes in price and quantity move in opposite directions.
Figure 2 shows that demand-driven inflation dropped sharply during both recessions. But once the recessions were over, demand-driven inflation recovered in response to fiscal and monetary policy actions designed to stimulate aggregate demand.
Figure 2
Demand-driven PCE inflation
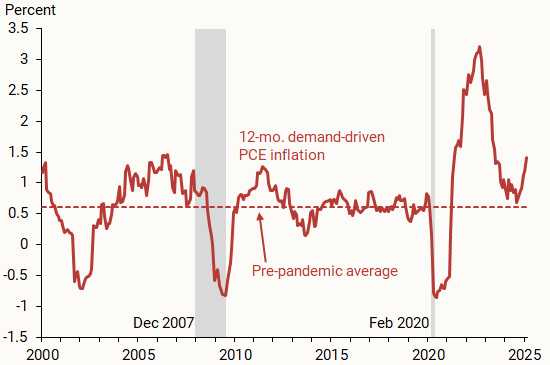
Source: Supply- and Demand-Driven PCE Inflation data page and author’s calculations.
Figure 3 shows that supply-driven inflation rose during the early stages of the Great Recession. This occurred in response to an oil price spike that pushed up inflation while pushing down economic activity. Supply-driven inflation later reversed course into negative territory when oil prices fell sharply as the Great Recession proceeded. The monthly average price per barrel of West Texas Intermediate crude oil fell from a peak of $134 to a low of $39.
Figure 3
Supply-driven PCE inflation
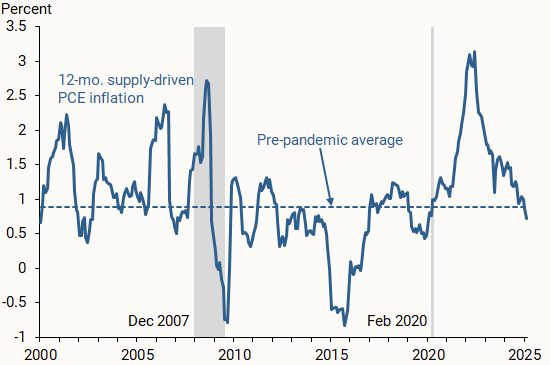
Source: Supply- and Demand-Driven PCE Inflation data page and author’s calculations.
At the onset of the 2020 recession, demand-driven inflation fell sharply in response to pandemic-induced closures and lockdowns. At the same time, supply-driven inflation rose in response to supply chain disruptions that raised the cost of delivered goods. Starting in early 2021, both inflation measures rose sharply before peaking in mid-2022 and then declining substantially. Recent demand-driven inflation remains above its pre-pandemic average and has resumed rising. Recent supply-driven inflation has returned to its pre-pandemic average and continues to decline. All else being equal, demand-driven inflation or expected inflation, or both, would need to decline further towards pre-pandemic averages to reach the Fed’s 2% goal for headline PCE inflation.
Simulating the influence of demand and supply on inflation
Simulations provide a way of assessing the relative importance of demand versus supply as drivers of inflation over different periods. For these simulations, I first estimate a Phillips curve-type relationship using data from January 2000 to February 2025. Specifically, I estimate an equation that relates 12-month PCE inflation to a constant and four explanatory variables: 12-month demand-driven PCE inflation, 12-month supply-driven PCE inflation, 1-year-ahead expected inflation from the SPF, and the 12-month lagged value of PCE inflation. The estimated equation accounts for 96% of the movements in PCE inflation over the sample period. To account for the response of expected inflation to any alternative inflation path, I estimate a separate equation that relates SPF expected inflation to a constant and two explanatory variables: the 1-month lagged value of SPF expected inflation and the 1-month lagged value of PCE inflation. The estimated equation accounts for 97% of the movements in expected inflation over the sample period.
Next, I feed only demand-driven inflation or only supply-driven inflation, one at a time from the observed data, into the estimated Phillips curve relationship while holding the counterpart measure constant at its December 2007 value. The value of expected inflation in the Phillips curve relationship responds to each alternative inflation path according to the estimated equation described above. The value of lagged inflation that appears in the Phillips curve relationship evolves along the path of each alternative inflation scenario.
Figure 4 shows the alternative inflation paths from each simulation starting in December 2007 together with actual headline PCE inflation (green line). The simulation with only demand-driven inflation (red line) accounts for part of the inflation decline during the Great Recession. The path then recovers and remains above 2% until the onset of the pandemic recession in February 2020. In contrast, the simulation with only supply-driven inflation (blue line) accounts for more of the inflation decline during the Great Recession. The path then recovers but remains persistently below 2% until February 2020. These results imply that supply forces were the main drivers of low inflation during the decade following the end of the Great Recession.
Figure 4
Simulated inflation paths based on separate drivers

Source: Bureau of Economic Analysis and author’s calculations.
Shapiro (2025) shows that movements in the federal funds rate influence demand-driven inflation but have no significant effect on supply-driven inflation. The results in Figure 4 showing that low inflation after the Great Recession was driven by supply forces helps to explain why inflation remained persistently below 2% during these years, despite a federal funds rate that was close to zero until December 2015.
As the alternative inflation paths continue into the pandemic era, the simulation with only demand-driven inflation (red line) produces a sharp drop in inflation starting in February 2020, consistent with actual headline PCE inflation. The path then rises and falls but remains above 2% at the end of the simulation. The simulation with only supply-driven inflation (blue line) also rises and falls, but to a lesser degree than the path with only demand-driven inflation. These results imply that demand was the primary driver of pandemic-era inflation, although the contribution of supply to inflation during the pandemic era was sizable.
In an expanded analysis, Lansing (2025) shows that results similar to those in Figure 4 are obtained using an alternative Phillips curve specification in which demand is based on the vacancy-unemployment ratio—a measure of labor market tightness—and supply is based on the New York Fed’s Global Supply Chain Pressure Index.
The source of inflationary demand forces during the pandemic era can be traced to fiscal and monetary policy actions designed to stimulate the economy in response to the pandemic. Cross-country studies by Jordà et al. (2022) and de Soyres, Santacreu, and Young (2022) find that fiscal stimulus was larger and subsequent inflation was higher in the United States than in other countries. Faria-e-Castro (2025) uses a medium-scale macroeconomic model to break down movements in inflation and output into impacts coming from various types of demand and supply shocks. He identifies expansionary fiscal and monetary policy shocks as the main drivers of high inflation during the pandemic era.
Conclusion
Simulations of alternative inflation paths using an estimated Phillips curve-type relationship provide insights into the relative importance of demand versus supply as drivers of inflation over different time periods. The results in this Letter and those in Lansing (2025) imply that the decade-long episode of low inflation after the Great Recession was driven mainly by supply forces, whereas the episode of high inflation during the pandemic era was driven mainly by demand forces. The contributions of demand and supply forces to inflation have both declined substantially since mid-2022 in response to the waning of fiscal policy stimulus, tighter monetary policy, and the recovery of supply chains after the pandemic.
References
de Soyres, François, Ana Maria Santacreu, and Henry Young. 2022. “Fiscal Policy and Excess Inflation During COVID-19: A Cross-Country View.” Federal Reserve Board FEDS Notes (July 15).
Faria-e-Castro, Miguel. 2025. “A Look at Inflation in Recent Years Through the Lens of a Macroeconomic Model.” FRB St. Louis, On the Economy Blog (January 6).
Jordà, Òscar, Celeste Liu, Fernanda Nechio, and Fabián Rivera-Reyes. 2022. “Why Is U.S. Inflation Higher Than in Other Countries?” FRBSF Economic Letter 2022-07 (March 28).
Jørgensen, Peter Lihn, and Kevin J. Lansing. 2025. “A Simple Measure of Anchoring for Short-run Expected Inflation in FIRE Models.” Economics Letters 246, Article 112050.
Lansing, Kevin J. 2025. “Demand versus Supply: Which Is More Important for Inflation?” Federal Reserve Bank of San Francisco Working Paper 2025-08.
Shapiro, Adam Hale. 2025. “Decomposing Supply and Demand Driven Inflation.” Journal of Money, Credit, and Banking, forthcoming.
Opinions expressed in FRBSF Economic Letter do not necessarily reflect the views of the management of the Federal Reserve Bank of San Francisco or of the Board of Governors of the Federal Reserve System. This publication is edited by Anita Todd and Karen Barnes. Permission to reprint portions of articles or whole articles must be obtained in writing. Please send editorial comments and requests for reprint permission to research.library@sf.frb.org