
Trade policy in the United States has been in flux in recent months. A theoretical analysis of recent increases in U.S. tariffs, including potential retaliatory tariffs by other countries, suggests a resulting drop in overall U.S. employment, although manufacturing employment increases. Results also indicate a decline in overall real income for the United States of around 0.4%, although this number masks important variation across U.S. states.
The United States trades a lot with other countries, particularly Mexico, Canada, and China—its top trading partners in recent years. Recent increases and proposed additional changes to tariffs on U.S. imports from these and other countries have the potential to significantly affect both domestic economic activity and the global trade landscape.
In this Economic Letter, we use the theoretical framework proposed in Rodriguez-Clare, Ulate, and Vasquez (2025) to analyze the effects of a specific set of potential tariff changes: a 25% increase in the import tariff on Canadian and Mexican goods, a 30% increase in the import tariff on Chinese goods, and a 10% increase in the import tariff on goods from all other countries. It is too early to tell exactly what tariffs will be ultimately enacted, how long they will remain in place, and which level of retaliation—if any—other countries will settle on. Thus, we simplify our framework by assuming that the tariff increases will last for four years and that other countries will impose the same levels of tariff increases they face on imports of U.S. goods.
Our model-based analysis finds that the assumed scenario of tariff increases would lead to an increase in employment for the U.S. manufacturing sector. However, this comes at the expense of employment in the services and agricultural sectors, resulting in a projected overall decline in U.S. employment. For the United States as a whole, inflation-adjusted income would fall around 0.4% by 2028, the last year the higher tariffs would be in effect in our scenario. Importantly, our analysis incorporates the likely redistribution of tariff-generated revenue and differential trade exposure across states. This allows us to study which states would gain or lose more from the tariff changes. Results suggest that 31 states would gain real income, in some cases as much as 1.7%, while the remaining 19 states would lose, with some experiencing declines greater than 2%.
A framework for analyzing the effects of tariffs
To properly model the effects of an increase in import tariffs, we use a framework that explicitly accounts for U.S. trade patterns. We follow the model in Rodriguez-Clare, Ulate, and Vasquez (2025), which incorporates data for 87 regions—50 U.S. states, 36 countries, and an aggregated region representing the rest of the world—and 15 sectors—12 manufacturing sectors plus home production, services, and agriculture. The framework matches actual trade and labor allocation patterns across sectors in the United States and other countries for the baseline period of 2024, the year before the tariff increases were introduced.
Individuals in the model are both consumers and producers. As consumers, individuals purchase goods and services produced in different locations across sectors. As producers, individuals can spend their time in two mutually exclusive ways: participating in formal employment in the labor market or engaging in home production. The home production sector is meant to capture time spent at home performing certain useful activities—such as caring for family members, cooking, or cleaning—or to enjoy leisure. If a person participates in the paid labor market, they choose an industry based on three characteristics: their individual skills and preferences; the cost of switching between sectors, meaning any extra costs of job search and retraining; and the expected total income that they would receive in each sector in current and future periods. Total income for a given sector in our framework incorporates not only the wages that workers in that industry receive but also any potential tariff revenue rebates—or tax cuts—that individuals in that sector might receive due to the higher fiscal revenue induced by tariffs.
Our framework does not allow for migration between states; existing studies, such as Autor, Dorn, and Hanson (2013), show that there is relatively little migration following trade-induced disruptions. However, the framework does allow for movements of individuals between sectors within a region, which has important implications for the reallocation patterns in the model economy after tariffs increase. The model also accounts for the cost of sending products between different regions. Furthermore, the framework incorporates the possibility that production in a given sector uses intermediate inputs from other sectors. This allows the model to capture the effects of tariff increases on regional and global supply chains, and it also means that, even if a sector does not directly face a tariff increase—as is the case in the service sector—it can still be indirectly affected through its use of intermediate inputs from sectors whose tariffs have increased.
Consequences of an increase in tariffs
Figures 1 and 2 show the impact that an increase in tariffs has on employment and real value-added across sectors through the lens of our model. The figures depict the manufacturing sector (blue line), services (green line), agriculture (red line), and the total across sectors (dashed gold line).
Figure 1 indicates that overall U.S. employment in our scenario falls as much as 0.2% while the higher tariffs are in place through 2028. This drop in employment occurs because participating in home production—where conditions are not directly affected by the tariff disruption—temporarily becomes more attractive than working in the labor market when tariffs are high.
Figure 1
Cumulative percent change in employment by sector
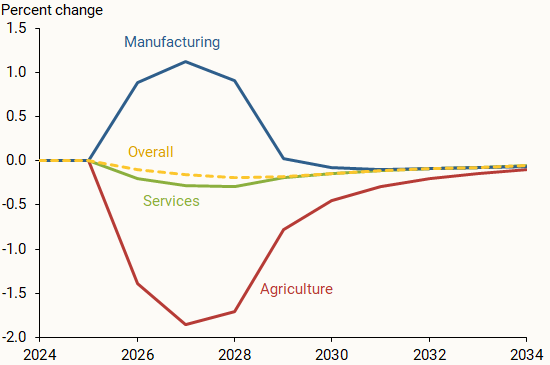
As discussed in Rodriguez-Clare, Ulate, and Vasquez (2023), the changes that emerge following tariff increases are driven by a variety of forces. First, there is a general decrease in demand due to the fall in spending power when more people are out of work, as shown by the decline in overall employment in Figure 1. Second, foreign inputs become more expensive due to the tariffs, which makes production less efficient and decreases labor demand. Third, there is an expenditure-switching effect: imports from other countries become more expensive and tend to be substituted with domestic production, increasing labor demand in net-importing sectors.
The United States is a net importer for manufacturing, so the expenditure-switching effect dominates the other two effects in this sector, and manufacturing employment increases up to 1.1%, reaching a peak in 2027. By contrast, the United States is a net exporter of services and has roughly balanced trade in agriculture. As a result, the expenditure-switching effect is less powerful in those sectors. The other two effects—the fall in aggregate demand and the increase in input costs—dominate, and employment falls 0.3% for services and 1.8% for agriculture.
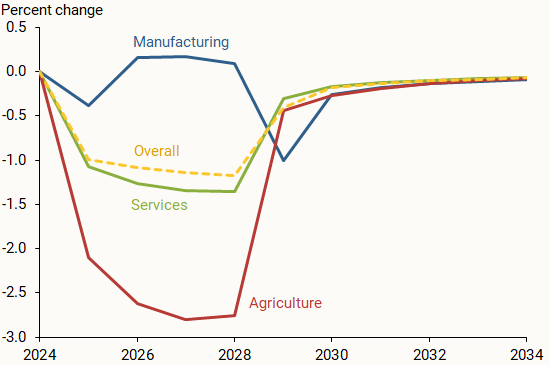
Figure 2 shows the cumulative percentage change in real value-added by sector in our scenario. Real value-added in our framework is measured by total labor compensation—wages times hours worked—in dollars divided by overall prices. Real manufacturing value-added increases up to 0.2%, while real service value-added decreases as much as 1.3% and real agricultural value-added decreases as much as 2.8%. Overall, real value-added falls by as much as 1.2%. The decline in overall real value-added through 2028 depicted in Figure 2 is partially offset by the increase in revenue rebates from tariffs. Therefore, real income—which coincides with real GDP and includes tariff revenue—only falls around 0.4% by 2028.
Figure 2
Cumulative percent change in real value-added by sector
Effects across U.S. states
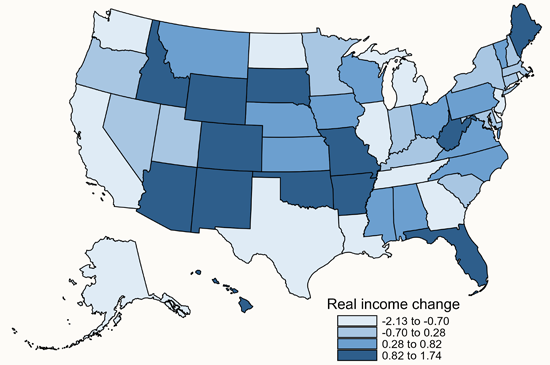
An important advantage of the framework we use, which separates U.S. data by state, is that it allows us to assess how the tariff changes might affect each state. The map in Figure 3 depicts the cumulative percent change in real income between 2024 and 2028 across U.S. states according to our framework. Some of the states where real income falls the most are Texas, California, and Michigan, while some of the states where it rises the most are Colorado, Wyoming, and Oklahoma. Broadly speaking, the states that lose the most from tariffs tend to have close trading links with the countries most affected by the tariffs. On the other hand, the states that benefit the most are typically not as highly integrated into global supply chains as the other states. While U.S. real income falls around 0.4% by 2028, this masks large cross-state differences in real income changes, which range from an increase of 1.7% to a decrease of 2.1%.
Figure 3
Percent income change by state between 2024 and 2028
Caveats
The results from our analysis should be treated as illustrating how the U.S. economy could be affected by the recent tariff increases and proposals, not as a precise forecast of what will occur. Most importantly, the tariffs that are enacted and sustained may turn out to be quite different from those that we have assumed. We set the tariff increases at the levels that were prevalent as of late May 2025. We also assume that they last for four years and are met by similar levels of retaliatory tariffs by the affected countries. The exact tariff changes finally implemented could diverge substantially from any of these assumptions.
More generally, our analysis is based on an abstract model of the industrial structure of the U.S. economy. Like any such model, a broad set of assumptions are needed for the model to be internally consistent. We have focused on one such set of assumptions in this Letter; however, Rodriguez-Clare, Ulate, and Vasquez (2025) explore a range of alternatives and find that the results can vary substantially. Moreover, the model is not designed to assess the impact of tariffs on overall inflation. It focuses instead on the changes in relative prices across sectors of the U.S. economy and, in turn, the impact on production activity across sectors and states. Finally, our framework does not incorporate time-varying trade deficits, capital accumulation, or the broader ramifications that may arise from heightened uncertainty or shifts in geopolitical dynamics induced by tariff changes.
Conclusion
In this Letter, we have used a quantitative model of trade and reallocation to assess the potential effects of an increase in U.S. tariffs according to a specific set of assumptions. We find an overall decline in employment and real value-added based on our scenario, with a smaller decline in real income due to redistribution of tariff revenues. However, because the United States is a net importer, the manufacturing industry stands out as an exception and sees temporary increases in employment. Separating U.S. data by state also suggests that changes in real income effects could vary widely across states, mainly due to the different exposure of each state to international trade.
References
Autor, David H., David Dorn, and Gordon H. Hanson. 2013. “The China Syndrome: Local Labor Market Effects of Import Competition in the United States.” American Economic Review 103(6, October), pp. 2,121–2,168.
Rodriguez-Clare, Andres, Mauricio Ulate, and Jose P. Vasquez. 2025. “The 2025 Trade War: Dynamic Impacts Across U.S. States and the Global Economy.” FRB San Francisco Working Paper 2025-09.
Rodriguez-Clare, Andres, Mauricio Ulate, and Jose P. Vasquez. 2023. “Supply Chain Disruptions, Trade Costs, and Labor Markets.” FRBSF Economic Letter 2023-02, January 19.
Opinions expressed in FRBSF Economic Letter do not necessarily reflect the views of the management of the Federal Reserve Bank of San Francisco or of the Board of Governors of the Federal Reserve System. This publication is edited by Anita Todd and Karen Barnes. Permission to reprint portions of articles or whole articles must be obtained in writing. Please send editorial comments and requests for reprint permission to research.library@sf.frb.org