

Understanding housing demand dynamics through two indicators, income growth and population growth, provides important insights into housing affordability. Research shows that average U.S. income growth is strongly related to rising house prices but is essentially unrelated to changes in the supply of housing units across metropolitan areas. Instead, greater population growth translates into greater housing supply growth, with housing supply generally outpacing population, even in expensive markets. Thus, differences in affordability across areas may reflect differences in the growth and type of housing demand rather than different housing supply constraints.
Housing costs have become a burden for many U.S. households. Discussions of how to improve housing affordability often focus on the role of housing supply constraints, particularly regulations. However, recent research has documented that such constraints are unable to account for the differences in affordability, house price growth, or housing supply (unit) growth across metropolitan areas (Louie, Mondragon, and Wieland 2025a, b).
In this Economic Letter, we focus instead on the role of housing demand using two indicators: average income growth and population growth. Our research suggests that differences in demand as reflected in these two indicators can offer a better explanation for the variation in housing dynamics from 2000 to 2020 across metro areas. We find that average income growth relates strongly to house price growth and that house prices generally keep pace with average income. However, there is almost no connection between average income growth and growth in housing supply. Instead, housing supply growth has a strong positive relationship with population growth. In fact, almost all metro areas saw housing units grow faster than their population—even in expensive residential markets like Los Angeles or San Francisco.
Although housing supply appears to react in similar ways across the country, our findings suggest that there are large differences in the drivers of housing demand that may explain the significant differences in house price and supply growth across U.S. metro areas. Places where economic growth translates into strong demand for highly skilled workers, such as San Francisco, will tend to have more growth in house prices and less growth in housing supply relative to places where there is very little income growth but significant growth in middle- or low-income jobs, like Houston. Critically, these growth dynamics are independent of housing supply constraints and so are more likely to reflect deeper trends in the underlying drivers of economic growth.
The housing affordability crisis and income growth
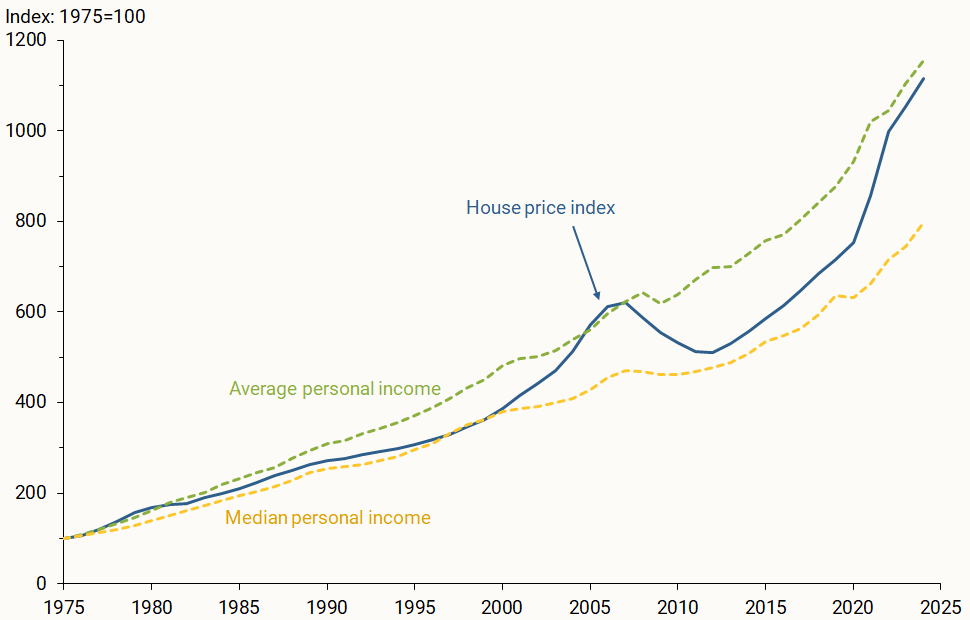
As an overview, Figure 1 plots growth in house prices, average personal income, and median personal income from 1975 to 2024, all normalized to equal 100 in 1975. Until about 2000, house prices (blue line) and median income (gold dashed line) tracked each other relatively closely. But from 2000 to 2024, house price growth far surpassed median income growth.
Figure 1
House prices and income, 1975 to 2024
A large body of research has argued that housing supply constraints can explain this divergence (see Glaeser and Gyourko 2025)—particularly that policies on residential zoning and density have reduced construction and driven up prices. However, recent research has shown that supply constraints cannot account for differences in house price or supply growth across U.S. cities (Louie et al. 2025a, b).
This research indicates that regulatory reforms may have limited impact on housing affordability and that differences in housing supply constraints are not the fundamental drivers of differences in housing dynamics across metro areas. Figure 1 suggests an alternative explanation: Average income, an indicator of housing demand (green dashed line), grew essentially one-for-one with house prices from 1975 to 2024, even though median income failed to keep up. In other words, house price growth may simply reflect growth in housing demand, driven in part by growth in average income, such that questions of housing affordability may primarily be about differences in income growth at the top of the distribution relative to the middle.
To check on the relationship between average income and housing markets, we turn to data across 321 metropolitan statistical areas (MSAs). Figure 2, panel A plots annualized house price growth on the vertical axis against annualized average income growth on the horizontal axis, both measured from 2000 to 2020 (chosen for data availability) and adjusted for inflation. The fitted blue line shows that growth in average income is strongly positively related to growth in house prices: On average, income growth across metro areas moves one-for-one with house price growth. However, the data points display notable dispersion across metro areas. Some metro areas, like Austin and Los Angeles, saw house prices grow more than average income, while others like Houston, Boston, and San Francisco saw house prices grow at about the same rate as average income. Critically, Louie et al. (2025b) show that these differences do not reflect differences in supply constraints.
Figure 2
Average income growth relative to house prices and number of units in sample metro areas
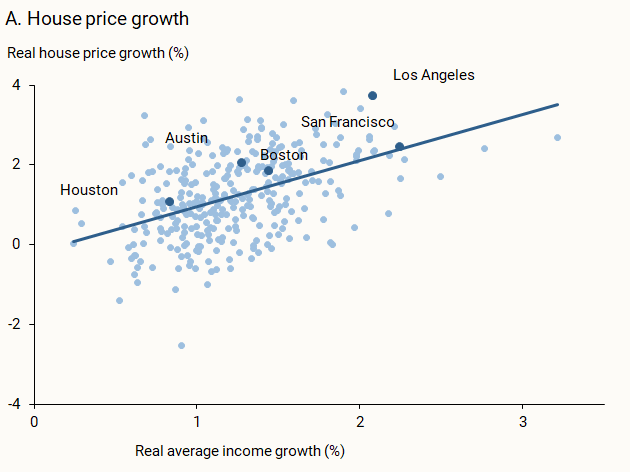
Source: Source: Bureau of Economic Analysis and Census Bureau.
By contrast, panel B shows little connection between average income and annualized growth in housing supply from 2000 to 2020. Some metro areas experience high income growth but little growth in housing supply while others experience relatively little growth in income and large growth in quantities. This suggests that, as income grows, there may be little effect on the demand for housing supply. If we control for population growth, there is essentially no relationship between the two.
What might be causing this lack of connection? One important possibility is that housing demand can vary with income levels. In areas with lower average income, households tend to be relatively large, with many individuals sharing a housing unit to reduce costs. As income rises, some growth translates into demand for additional housing units to reduce crowding. Thus, as a society becomes relatively wealthy, household size declines and housing unit demand increases. But once households are relatively small—as they are on average in the United States—then additional income increases may not translate as much into demand for additional housing supply. Instead, many households may prefer renovating, relocating to a more attractive location, or otherwise increasing their demand for housing quality. Consistent with Figure 2, growth in housing demand will increase prices but not necessarily increase the demand for—and thus supply of—housing units.
However, even though growth in housing supply is not tightly linked to average income growth, supply should be linked to another demand indicator, population growth. At sufficiently high incomes, new households in an area will require additional living space, and so growth in housing supply should closely track population growth.
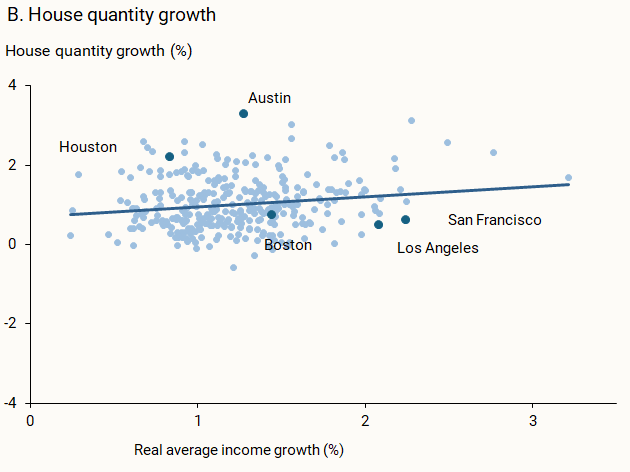
Figure 3 depicts this relationship between population and housing supply growth. The data show that housing supply growth is strongly related to population growth across essentially all metro areas. Moreover, about 85% of metro areas had more growth in housing quantities than in population; this is shown by most of the data lying above the dashed red “balanced growth” line, which indicates the housing growth rate that would match population growth with no change in average household size. Moreover, Louie et al. (2025b) show that the rate at which population growth translates into house price growth is independent of measured supply constraints, all of which points to supply constraints not explaining differences in housing affordability.
Figure 3
Population growth and housing quantity growth
Housing demand and the labor market
How much a metro area’s overall growth is driven by average income growth relative to population growth is likely to help explain differences in housing dynamics and affordability.
The labeled data points in the figures illustrate some of those dynamics. For example, Figure 3 shows that Houston and Austin experienced high population growth, while San Francisco and Los Angeles experienced population growth closer to the average. At the same time, Figure 2 panel A shows that San Francisco and Los Angeles experienced some of the highest income growth, while Austin and Houston had average or below-average income growth. Therefore, among the range of experiences, some metro areas are dominated by income growth with relatively less growth in population, while others have modest income growth but stronger growth in population. Taken together, these results point to two critical features of local housing and labor markets.
First, the extent to which housing demand affects prices, quality, and supply depends on the nature of the demand change. Changes in the demand for housing quality will primarily affect house prices and leave demand for the number of housing units relatively unchanged, consistent with the patterns in Figure 2. In this case, construction will be oriented toward upgrading the existing stock or reallocating housing to more desirable areas. In contrast, changes in housing demand coming from population growth, holding average income fixed, will increase demand for the number of units, driving up both prices and quantities of housing, consistent with the relationship in Figure 3.
Second, the relative importance of these two kinds of housing demand can vary significantly across metro areas due to local labor market dynamics. Some metro areas have seen large increases in the demand for housing quality, driven by growth in wages for specialized jobs and changes in amenities attractive to high-income households (Diamond 2016). This results in soaring prices and—because very high wages suggest that fewer workers can fill those jobs—only modest growth in population and housing supply. Other metro areas have instead seen broader-based growth in low- or middle-income jobs, which translates into growth in spending on housing from both demand for more supply and demand for higher quality supply. This leads to both higher prices and higher supply due to the larger number of households that can move to those areas and work those jobs.
Thus, differences in the composition of income growth and its translation into housing demand—as opposed to differences in housing supply—can explain both the higher average price growth and low growth in quantity in some metro areas relative to others. This suggests that housing markets may simply reflect the underlying dynamics in the labor market, such as the strong demand for highly skilled workers along with the hollowing out of middle-skill jobs described by Autor (2019).
Conclusion
Much of the intense interest in addressing the housing affordability crisis has focused on limitations to the housing supply. In this Letter, we argue that differences in the type of underlying labor market growth and subsequent implications for housing demand may offer a better explanation for important housing market dynamics. This suggests that the housing affordability crisis may be best addressed by understanding changes to the labor market, especially the relative distribution of economic growth across income levels and jobs in different areas.
References
Autor, David H. 2019. “Work of the Past, Work of the Future.” AEA Papers and Proceedings 109(May), pp. 1–32.
Diamond, Rebecca. 2016. “The Determinants and Welfare Implications of U.S. Workers’ Diverging Location Choices by Skill: 1980–2000.” American Economic Review 106(3), pp. 479–524.
Glaeser, Edward L., and Joseph Gyourko. 2025. “America’s Housing Supply Problem: The Closing of the Suburban Frontier?” NBER Working Paper 33876.
Louie, Schuyler, John Mondragon, and Johannes Wieland. 2025a. “Frequently Asked Questions About and Comments on ‘Supply Constraints Do Not Explain House Price and Quantity Growth Across U.S. Cities.’” FRB San Francisco Working Paper 2025-06 online appendix.
Louie, Schuyler, John Mondragon, and Johannes Wieland. 2025b. “Supply Constraints Do Not Explain House Price and Quantity Growth Across U.S. Cities.” FRB San Francisco Working Paper 2025-06.
Opinions expressed in FRBSF Economic Letter do not necessarily reflect the views of the management of the Federal Reserve Bank of San Francisco or of the Board of Governors of the Federal Reserve System. This publication is edited by Anita Todd and Karen Barnes. Permission to reprint portions of articles or whole articles must be obtained in writing. Please send editorial comments and requests for reprint permission to research.library@sf.frb.org