
The large increase and subsequent decline of unauthorized immigrant workers in recent years have raised questions about the impact of these changes on local labor markets across the United States. New analysis linking immigration data with employment data for specific areas suggests that the rapid rise in unauthorized immigrant worker flows increased local employment roughly one-for-one. Extending the analysis to the industry level further suggests that the slowdown of net immigration had a large negative impact on local employment, particularly for construction and manufacturing.
The rapid rise in unauthorized immigration beginning in 2021 and its slowdown starting in 2024 have prompted an important question for U.S. labor markets: How much can unauthorized immigration explain the recent swings in employment growth? In this Economic Letter, we address this question using new estimates of unauthorized immigrant worker flows (UIWF) for local labor markets across the United States, described more fully in Wilson and Zhou (2025).
We merge our geographical immigrant worker flow data with local employment data to estimate the effects of unauthorized immigration on employment. To understand the evolution of these effects, we analyze this relationship separately for the rapid rise in immigration from March 2021 to March 2024 and its slowdown from March 2024 to March 2025. We find a nearly one-for-one effect of UIWF on employment growth in both periods. This finding holds whether or not we allow for reverse causality coming from local economic conditions affecting immigrant inflows. Looking at the implications for industry-level employment suggests that local immigration slowdowns have reduced employment, especially in construction and manufacturing.
Data on unauthorized immigrant worker flows
We construct our measure of unauthorized immigrant worker entries and exits, or flows, by combining individual-level immigration court data from the Transactional Records Access Clearinghouse with other data, as detailed in Wilson and Zhou (2025). Immigration court data cover the vast majority of unauthorized immigrants who have entered the United States since 2021. The court data provide age, country of origin, location of U.S. residence, and dates of entry and exit for all individuals who are undergoing immigration court proceedings after receiving a notice-to-appear from Customs and Border Patrol or Immigration and Customs Enforcement. In Wilson and Zhou (2025), we use this information, along with other measures of individuals not covered by court data, to construct a monthly data set of unauthorized immigrant worker flows (UIWF) from 2013 to mid-2025 for all U.S. counties.
For this study, we define “unauthorized” net immigration as entries into minus the exits out of the United States of individuals who entered the country without being formally admitted for the purposes of immigration law. This does not mean they lacked authorization to remain after entry. Indeed, most individuals who enter the country without formal admission are encountered by federal agents at a port of entry, along the border, or in the interior and then receive a notice-to-appear in immigration court to seek asylum or otherwise challenge their removal. The vast majority are permitted to remain in the country while their case proceeds in the court system, which can take a fairly long time, generally 1 to 3 years. During this time, they might work with or without a work permit as discussed in Foote (2024).
Our analysis in Wilson and Zhou (2025) uses these individual-level immigration court data to first construct county-by-month counts of entries and exits of working-age adults—the basis for developing a count of net entry. We then adjust these numbers to account for the categories of unauthorized immigration not covered by the court data, such as individuals in temporary immigration parole programs or those who entered the country without being encountered by federal agents. We also adjust these counts to focus on likely workers, using the historical employment rate of immigrants from countries that account for the vast majority of border patrol encounters. This historical employment rate is roughly 70%, according to data from the American Community Survey.
We aggregate our county-level UIWF data into slightly broader geographic areas known as commuting zones that are designed to measure local labor markets. These zones, which cover the entire United States, are groupings of contiguous counties that share high levels of intercounty commuting.
Assessing the effects on local employment
We pair our UIWF data with monthly employment data for local labor markets from the Census of Employment and Wages (CEW). The CEW provides county-by-industry data based on state-level unemployment insurance administrative records covering virtually all private nonfarm employment.
As an initial look at the data, Figure 1 shows a simple scatter plot relating unauthorized immigrant worker flows in each commuting zone on the horizontal axis to that area’s employment growth on the vertical axis for the rapid rise (in blue) and the slowdown (in green). The size of each circle is proportional to the area’s initial employment level. As noted above, we define the rapid rise period of increasing immigration as March 2021 to March 2024, and the slowdown as March 2024 to March 2025, starting and ending with the same calendar month to avoid complications from CEW data not being seasonally adjusted.
Figure 1
Employment growth relative to UIWF

Source: Bureau of Labor Statistics, Wilson and Zhou (2025); and authors’ calculations.
The data show a clear positive relationship in both periods, as shown by the upward slope of the fitted green and blue lines. Indeed, the slopes of these lines are close to 1, indicating a roughly one-for-one relationship between UIWF and employment across commuting zones in both periods.
Note that the slopes in Figure 1 reflect correlations and not necessarily the causal links from immigration to employment. The observed UIWF into a local area may be driven both by demand factors—for example, the possibility that strong local economic conditions reflected in employment growth attract more immigrant workers to the area—and by supply factors unrelated to local labor demand. To isolate the effect of supply-driven immigrant worker flows on employment, we employ an estimation technique commonly used in the literature on immigration (Card 2001, Saiz 2007, and Burchardi, Chaney, and Hassan 2019).
This technique utilizes the tendency, documented in past studies, of new immigrants from a given country-of-origin to settle in similar proportions to the geographic distribution of the existing foreign-born population from that country. Following this approach, we predict the supply-driven flow of unauthorized immigrant workers into each local labor market, separate from the portion of immigration flows in an area driven by demand factors. Specifically, the predicted value for a given local area is the weighted sum, across countries of origin, of total unauthorized net immigration into the United States for a country of origin, weighted by a local area’s share of past immigrants that came from that country of origin.
For example, say that 10% of Hondurans entering the United States and 20% of Nicaraguans entering the United States in the past have settled in Chicago. If, in the current period, the United States experiences net unauthorized immigration of 100,000 Hondurans and 200,000 Nicaraguans (and no other immigration), our method would predict that Chicago would see 10% of 100,000 plus 20% of 200,000, equaling net new immigrants of 50,000. Our analysis uses such predictions as measures of local UIWF that are unrelated to current local labor demand. Consistent with the prior literature, we find these predicted flows are highly correlated with the actual flows of unauthorized immigration.
These estimates capture both the direct effect of UIWF on measured employment and any indirect outcomes, such as local multiplier effects. For example, an influx of immigrants into a local area could increase demand for local services, which could boost service-sector employment. Alternatively, an increase in local labor supply due to immigration could crowd out other local workers.
Our estimates of the causal effect of UIWF on employment yield very similar results to the slopes shown in Figure 1 for both periods. Specifically, we estimate that an increase in UIWF equal to 1% of local employment raises local employment by 0.92% (standard error of 0.17) in the rapid rise period and by 1.16% (standard error of 0.49) in the slowdown period. These estimates are statistically indistinguishable from 1 and from each other at standard significance levels.
Our results suggest that official employment data accurately depict the effects of unauthorized immigrant employment. They also suggest that any positive local multiplier effects and negative crowd-out effects, if they exist, roughly offset each other.
Which industries have been most affected by unauthorized immigration?
To understand the effects of unauthorized immigration across different industries, we repeat our analysis method with industry-specific employment growth. If UIWF affects all industries equally—that is, in the same proportions as industries’ shares of employment—we would expect the estimated effect for every industry to equal its typical share of total employment.
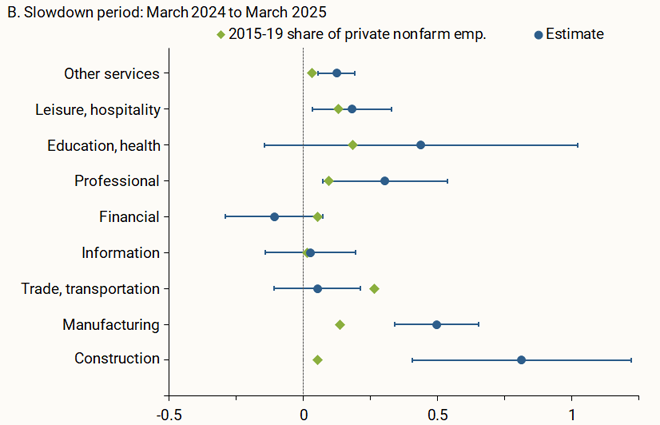
Figure 2 shows our estimates for each industry (blue dots) along with the industry’s typical national employment share from 2015 to 2019 (green diamonds). The brackets around each of our estimates indicate the 95% confidence interval.
Figure 2
Effects of UIWF on employment by major industry
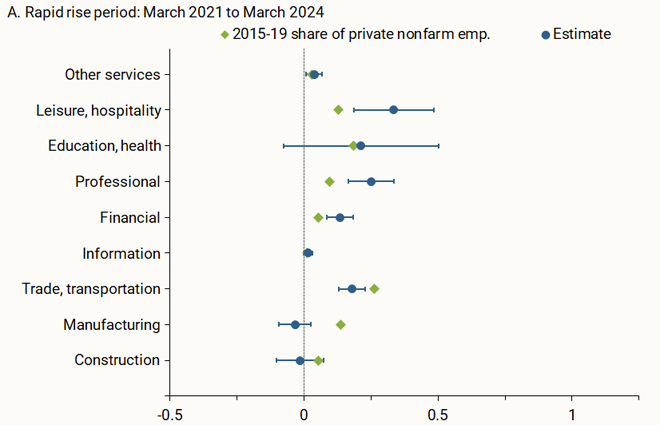
Panel A shows the increase in UIWF during the rapid rise period had particularly large effects on employment in leisure and hospitality, professional services, and other services. That is, in these industries, employment rose with immigration more than would be expected if immigrant workers went into industries in the same proportion as all workers did in past years.
Panel B shows that the decrease in UIWF during the slowdown period had particularly large effects in construction, manufacturing, and other services. Because UIWF was slowing in most places, this result implies that, on average, places experiencing the biggest slowdowns in unauthorized immigration saw the biggest slowdowns in employment growth in construction, manufacturing, and other services. The effect for the construction sector is particularly notable, because it suggests that falling UIWF in recent months could be slowing residential construction and hence slowing down the growth of housing supply.
Conclusion
In this Letter, we use newly constructed data on unauthorized immigrant worker flows in local labor markets to estimate their effects on local employment during both the recent rapid rise period and slowdown period in immigration. We found a nearly one-for-one causal effect of unauthorized immigration worker flows on employment growth in both periods. Industry-level estimates suggest that recent immigration slowdowns have reduced employment disproportionately in construction and manufacturing.
These results suggest that unauthorized immigrant employment is accurately reflected in the official employment data. Furthermore, they suggest that U.S. employment growth is likely to face continued downward pressure as long as the ongoing declines in unauthorized immigrant worker flows continue.
Opinions expressed in this FRBSF Economic Letter do not necessarily reflect the views of the management of the Federal Reserve Bank of San Francisco, the Federal Reserve Bank of Dallas, or the Board of Governors of the Federal Reserve System.
References
Burchardi, Konrad B., Thomas Chaney, and Tarek A. Hassan. 2019. “Migrants, Ancestors, and Foreign Investments.” Review of Economic Studies 86(4), pp. 1,448–1,486.
Card, David. 2001. “Immigrant Inflows, Native Outflows, and the Local Labor Market Impacts of Higher Immigration.” Journal of Labor Economics 19(1), pp. 22-64.
Foote, Christopher L. 2024. “Quantifying the Recent Immigration Surge: Evidence from Work-Permit Applications.” Federal Reserve Bank of Boston Working Paper 24-15.
Saiz, Albert. 2007. “Immigration and Housing Rents in American Cities.” Journal of Urban Economics 61(2), pp. 345–371.
Wilson, Daniel J., and Xiaoqing Zhou. 2026. “New Data Show Intensifying Unauthorized Immigration Decline, With Large Local Variations.” Dallas Fed Economics blog, January 13, Federal Reserve Bank of Dallas.
Opinions expressed in FRBSF Economic Letter do not necessarily reflect the views of the management of the Federal Reserve Bank of San Francisco or of the Board of Governors of the Federal Reserve System. This publication is edited by Anita Todd and Karen Barnes. Permission to reprint portions of articles or whole articles must be obtained in writing. Please send editorial comments and requests for reprint permission to research.library@sf.frb.org