

Survey responses from chief financial officers and other financial decisionmakers yield a new measure of inflation expectations. Rather than asking about expectations for overall inflation, this survey asks about expected price growth at each respondent’s business. Aggregating survey responses provides an economy-wide indicator that tracks well with actual core consumer price index inflation. Survey responses collected before and during the recent oil shock imply that core inflation could remain elevated this year if the historical relationship between financial officer expectations and realized core inflation persist.
Inflation expectations matter, both as an indicator of where inflation might be headed and as an influence on actual pricing decisions. For instance, if households and businesses begin to expect higher inflation, it may become self-fulfilling. Empirical research confirms that expectations help predict future inflation and are correlated with how businesses set prices (Hajdini et al. 2025). As such, Federal Open Market Committee (FOMC) members pay close attention to inflation expectations when deliberating monetary policy.
Inflation expectations are typically measured using surveys that ask households, businesses, or professional forecasters about economy-wide projections. In this Economic Letter, we study inflation expectations derived from a different approach, asking business survey respondents to report expected price growth at their own firms. This approach has the advantage that respondents—typically a company’s chief financial officer (CFO) or other financial decisionmaker—are likely to be better informed about their own plans for price changes than about economy-wide inflation. We find one-year-ahead expected price growth averaged across firms closely tracks realized core consumer price index (CPI) inflation over long periods, especially when compared with other measures of inflation expectations. The most recent survey data suggest that core CPI inflation may remain elevated over this year if these historical relationships continue to hold.
The CFO Survey
The CFO Survey is a quarterly panel of business leaders run by a collaboration between Duke University’s Fuqua School of Business and the Federal Reserve Banks of Richmond and Atlanta (Graham et al. 2020). Aggregated data are available beginning in 2001 and include firms of all sizes, across all major industries—from small owner-operated businesses to large multinational corporations.
Survey respondents include individuals with financial decisionmaking authority, such as CFOs, treasurers, vice presidents, and senior accountants. For simplicity, and consistent with the survey’s title, we refer to all respondents as “CFOs” throughout the remainder of this Letter. While the survey elicits CFOs’ views on the broader U.S. economy, much of its focus is on respondents’ expectations about their own firms. In particular, it asks respondents to report their expected year-over-year change in their firm’s prices for the upcoming calendar year. The exact wording of this question varies somewhat across survey waves. Before 2020, it referred to general price growth across the firm’s offerings, whereas since 2020 it has asked about the price of the product line or service that accounts for the largest share of domestic revenue. Our sample spans 2001–2026 and therefore includes responses under both formulations. Note that the first-quarter survey for 2026 was fielded from February 17 to March 5, overlapping with the onset of the Iran conflict and the subsequent spike in crude oil prices. The survey’s focus differs from other business surveys that tend to emphasize expectations for the broader U.S. economy, such as the Cleveland Fed’s Survey of Firms’ Inflation Expectations (SoFIE).
Using the CFO Survey to measure inflation expectations
Each survey response provides a CFO’s expectation for how prices at their company will change over the coming year. The survey reports average firm-level forecasts, weighted by sales or revenue at each firm. We focus on expectations collected in the fourth quarter (Q4) CFO Survey of each year, which we refer to as CFO price growth expectations and treat as one-year-ahead forecasts. We then compare it to realized core CPI inflation over the subsequent calendar year. The sectoral composition and sales-revenue weights in our measure reflect the distribution of firms in our sample, which differs from the CPI basket using overall household consumption patterns. Larger firms receive proportionally more weight in our measure.
Figure 1 compares CFO price growth expectations (blue line), measured in Q4 of the preceding year, with realized annual core CPI inflation (dashed gray line), measured as the fourth-quarter over fourth-quarter percent change, in the current year. For example, data for 2002 reflect CFO expectations reported in 2001:Q4 and core CPI inflation measured from 2001:Q4 to 2002:Q4. If CFO price growth expectations had perfectly forecast core CPI inflation, the two lines would be indistinguishable. The gap between the lines represents the forecast error in each year.
Figure 1
CFO expected price growth and annual core CPI inflation
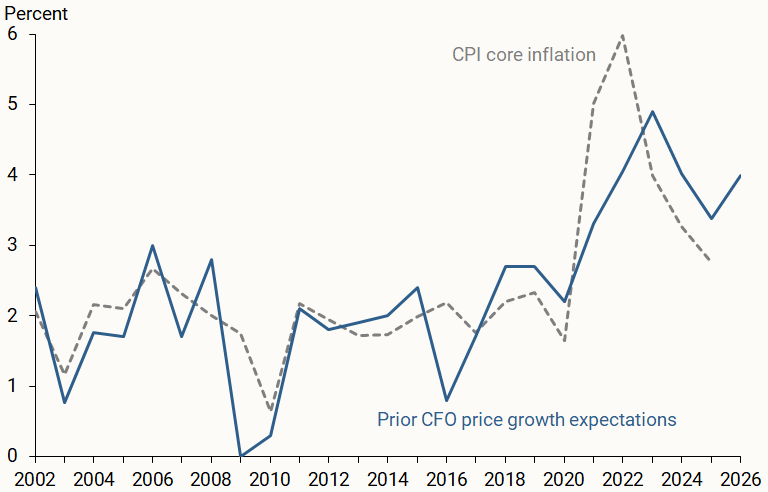
Source: CFO Survey, Bureau of Labor Statistics, and authors’ calculations.
Overall, CFO price growth expectations track realized inflation quite closely. During the pandemic, they captured the broad pattern—a modest dip in 2020 followed by a sharp increase—but understated the magnitude of the actual price surge. Over the pre-pandemic period (2001–2019), CFO price growth expectations averaged 1.8%. Since 2021, expectations have been markedly higher, peaking at 4.9% for 2023 before declining to 3.4% for 2025. The most recent reading for calendar year 2026, collected before and during the recent oil shock, is 3.6%, still well above pre-pandemic norms.
CFO price growth expectations compared with other measures
We compare CFO price growth expectations with three widely watched measures: household expectations from the University of Michigan Surveys of Consumers, business expectations from the Cleveland Fed’s SoFIE, and median professional forecasts for core CPI inflation from the Philadelphia Fed’s Survey of Professional Forecasters (SPF). Each of these surveys asks respondents to forecast inflation for the overall U.S. economy. In contrast, the CFO Survey asks about the respondent’s own prices. This distinction matters. CFOs are likely well informed about their own costs, demand conditions, and planned price changes. Thus, because the question is tied to a concrete decision margin (pricing), it can complement measures that ask about economy-wide inflation.
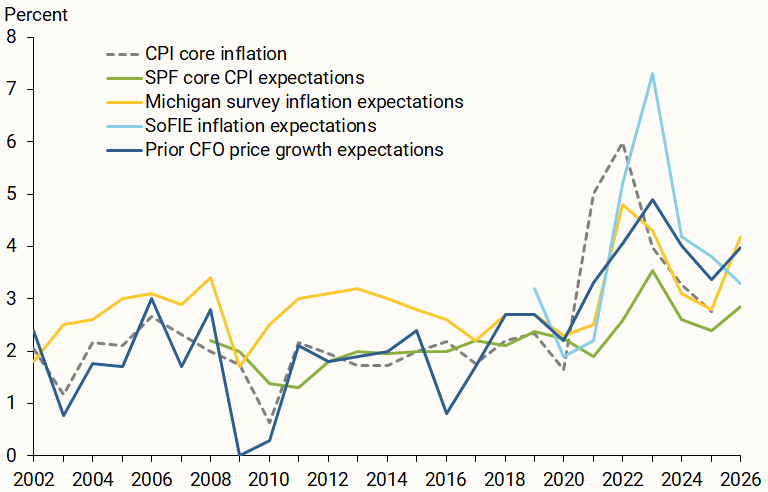
For each series, panel A of Figure 2 plots expectations reported in the prior year alongside realized core CPI inflation in the current year. Before the pandemic, household expectations from the Michigan survey typically exceeded core CPI inflation. They undershot the pandemic price surge but have since closely tracked inflation (Gourio and Sarma 2025). Professional forecasters before the pandemic tracked core inflation well but anticipated a smaller price increase in 2021–22 than other groups. Business expectations from SoFIE, though more limited in historical coverage, was the only measure to capture and then overshoot the pandemic price surge.
Figure 2
CFO survey and other inflation expectation surveys
Panel A. Inflation expectations versus realized inflation
Panel B. Forecast errors for selected inflation expectation surveys
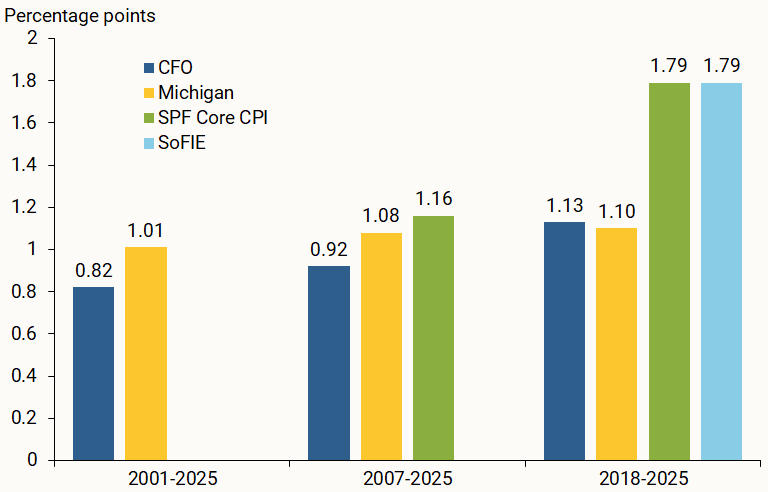
Note: Inflation expectations reported in the year prior to realized core CPI inflation. Forecast errors reflect root mean-squared errors relative to core CPI inflation.
Source: University of Michigan Surveys of Consumers, FRB Cleveland’s Survey of Firms’ Inflation Expectations (SoFIE), FRB Philadelphia’s Survey of Professional Forecasters (SPF), CFO Survey, Bureau of Labor Statistics, and authors’ calculations.
Panel B of Figure 2 reports the root mean-squared forecast error (RMSE) for each measure across three sample periods, each reflecting data availability. RMSE captures the gap between expected and realized core CPI inflation in percentage points. A lower RMSE means a more accurate forecast. The first group shows the full CFO sample (2001–2025), over which only the Michigan survey is also available: CFO expectations are more accurate, with an RMSE of 0.82 percentage point versus 1.01 for Michigan.
The second group begins in 2007, when the median SPF forecast for core CPI inflation becomes available. CFO expectations again have the lowest RMSE (0.92), followed by the Michigan survey (1.08) and the SPF (1.16). The third group starts in 2018, when SoFIE data begin; here, Michigan edges out CFO expectations by a narrow margin (1.10 versus 1.13), while the SPF and SoFIE data are considerably less accurate (both 1.79).
The strong post-pandemic performance of the Michigan survey relative to professional forecasters was documented by Gourio and Sarma (2025). We find that CFO expectations perform similarly to Michigan over this period, suggesting that both CFO and household expectations captured the recent inflation dynamics better than professional forecasters did.
How have CFO expectations evolved?
Because the CFO Survey is quarterly and asks about the next calendar year, it also lets us track how price growth expectations update as news arrives. The year 2025 is particularly notable, as the Liberation Day tariff announcements in April were widely anticipated to raise costs for many firms and, in turn, consumer prices.
Figure 3 shows how CFO price growth expectations for 2026 changed over the course of 2025. Even before the tariff announcements, the first-quarter 2025 reading of 3.5% was well above the pre-pandemic average (de Soyres, Pradhan, and Saijid 2026). Between the first and second quarters, expectations rose nearly a full percentage point on average—the largest quarter-to-quarter revision since the pandemic (see also Edwards and Weitz 2025). The increase was broad-based: Expectations rose in all major sectors, with the largest revision in services and the smallest in retail and wholesale trade. Expectations moderated in the second half of the year, consistent with partial tariff reversals, but remained above their first-quarter levels. The one exception was retail and wholesale trade, where expectations continued to rise through the third quarter—likely reflecting lagged pass-through of higher input costs as inventories turned over.
Figure 3
Evolution of price growth expectations for 2026
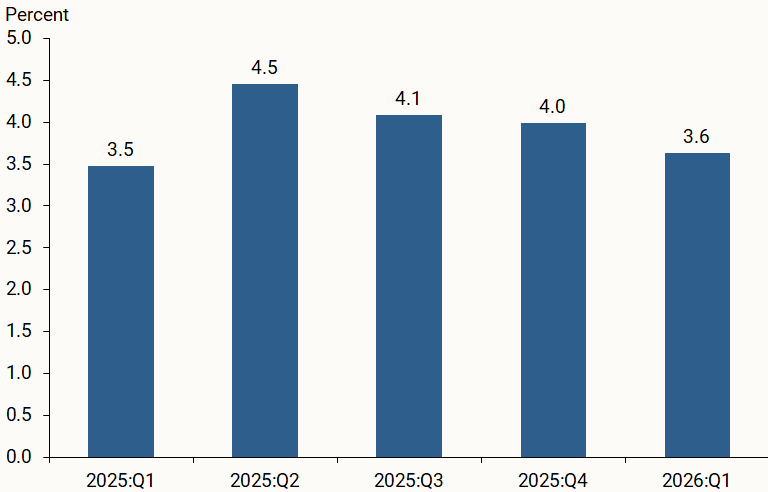
Source: CFO Survey and authors’ calculations.
Based on data from the first quarter of 2026, CFOs reported price growth expectations of 3.6% for this calendar year. If the relationship shown in Figures 1 and 2 continues to hold, the CFO measure would be consistent with core CPI inflation remaining elevated this year.
These latest CFO expectations are lower than the 4.2% projection from the Michigan survey but higher than the SPF’s 2.9% projection and SoFIE’s 3.3%. As noted earlier, CFO expectations have remained well above their pre-pandemic average, and the gap between the CFO expectations and the professional forecasts for 2026 is consistent with this pattern. Whether this gap signals that firm-level pricing pressures remain elevated or that professional forecasters have begun to predict a return to pre-pandemic norms, and that companies have not, could be an important consideration for the inflation outlook.
Conclusion
The CFO Survey provides a unique measure of inflation expectations that closely tracks core CPI inflation. The CFO price growth expectations for 2026 described in this Letter suggest that inflation may remain above the Federal Reserve’s 2% target in the near term. At the same time, the moderation in expectations after the April 2025 tariff announcements offers some reassurance that inflationary pressures may be stabilizing.
Looking ahead, the CFO measure may be particularly informative during periods of supply-side shocks, when businesses have direct visibility into cost pressures that traditionally take time to appear in overall price indexes. Continued monitoring of this measure—alongside traditional surveys—can help policymakers assess whether inflation pressures are building or stabilizing.
References
Abdelrahman, Hamza, Kevin J. Lansing, and Luiz E. Oliveira. 2024. “Examining the Performance of FOMC Inflation Forecasts.” FRBSF Economic Letter 2024-29 (November 12).
de Soyres, François, Avani Pradhan, and Zina Saijid. 2026. “Is the Inflation Process in Advanced Economies Different After the Pandemic?” FEDS Notes (March 30), Board of Governors of the Federal Reserve System.
Edwards, Zach, and Daniel Weitz. 2025. “Uncertainty Declines, Tariffs Persist: Measuring the Impact of Tariffs on CFOs’ Price and Cost Growth Forecasts.” The CFO Survey (September 24), FRB Richmond Research & Commentary.
Gourio, François, and Kavitya Sarma. 2025. “Forecasting Inflation During the Pandemic: Who Got It Right?” Chicago Fed Letter 513, FRB Chicago (September).
Graham, John, Brent Meyer, Nicholas Parker, and Sonya Ravindranath Waddell. 2020. “Introducing the CFO Survey.” The CFO Survey (May 15), FRB Richmond Research & Commentary.
Hajdini, Ina, Adam Shapiro, A. Lee Smith, and Daniel Villar. 2025. “Inflation Since the Pandemic: Lessons and Challenges.” Finance and Economics Discussion Series 2025-070 (August).
Opinions expressed in FRBSF Economic Letter do not necessarily reflect the views of the management of the Federal Reserve Bank of San Francisco or of the Board of Governors of the Federal Reserve System. This publication is edited by Anita Todd and Karen Barnes. Permission to reprint portions of articles or whole articles must be obtained in writing. Please send editorial comments and requests for reprint permission to research.library@sf.frb.org