Download PDF (364 kb)
Download Chart Data (48 kb)
Summary
The 2021 Diary of Consumer Payment Choice (Diary) finds that the COVID-19 pandemic has continued to affect the way U.S. consumers use and hold cash. The share of payments made in cash dropped sharply from 2019 to 2020 and then increased slightly in 2021, implying that cash use hit its lowest point in the first pandemic year. In contrast to cash use, consumers’ cash holdings remained elevated in 2021 when compared to 2019 and prior years, indicating that consumers continued to demand cash in the uncertain environment of the pandemic’s second year.
The increase in the number and share of cash payments from 2020 to 2021, although small, is notable because this is the first year-over-year increase in cash use recorded since the Diary began in 2016. From 2016 through 2019, the share of payments made in cash had been drifting slightly lower by about one percentage point per year. The 2021 increase after the seven-percentage-points drop in cash share in the first COVID-19 year could imply that consumers’ transactional use of cash may have reached its floor during the pandemic.
Key findings from this nationally representative survey highlight how consumer cash preferences changed with the COVID-19 pandemic:
- In October 2021, the average number of cash payments increased from six to seven payments and accounted for 20 percent of all payments, up from 19 percent in 2020 and down from 26 percent in 2019.
- The share of in-person purchases and person-to-person (P2P) payments increased to 82 percent, up from 80 percent in 2020 and down from 87 percent in 2019.
- The value of cash held in a consumer’s pocket, purse, or wallet (called on-person holdings) averaged $67 in 2021, compared to $76 in 2020 and $60 in 2019.
- The value of cash held in a consumer’s home, car, or elsewhere (called store-of-value holdings) remained elevated at $347, compared to $299 in 2020 and $241 in 2019.
Overall, results showed that a substantial portion of the population continued to use cash to make everyday purchases and to hold cash as a store of value.
Since 2016, the Federal Reserve has conducted this annual consumer survey to better understand the payment habits of U.S. consumers.1 Participants report all payments over a three-day period, the value of their cash holdings, the payment instruments they have adopted, and their preferences for various types of payments.
Acknowledgements
This paper would not have been possible without the support and contributions of the following individuals. From the Atlanta Fed: David Altig, Kevin Foster, Claire Greene, Marcin Hitczenko, Brent Meyer, Brian Prescott, and Oz Shy. From the Boston Fed: Ruth Cohen and Joanna Stavins. From the San Francisco Fed: Jennifer Chamberlain Tom Flannigan, Simon Kwan, and Sandra Rolnicki. From Federal Reserve Financial Services: Alexander Bau, Haley Gibson, Ben Gold, Mark Gould, Jacqueline Gustner, Jamie Law, Lindsey Pannell, Roger Replogle, Margaret Riley, Steve Son, and Kathleen Young.
Trends in Cash Use
2021 cash use and total number of payments were consistent with 2020
COVID-19 continued to influence consumer behavior 19 months into the pandemic. Prior surveys—the October 2020 diary and supplemental surveys conducted in April 2020, August 2020, and April 2021—showed a significant decrease in the share of consumers who made in-person payments and a decrease in the share of people who used cash to make payments compared to 2019.2,3 That behavior continued in October 2021. The differences in the estimates for 2020 and 2021 highlighted in the paper are not statistically significant unless otherwise noted indicating consumer shopping and payment choices continued to be affected by the pandemic.
The average number of payments remained below pre-pandemic levels at 36 monthly payments, down two payments from 2019.4 The number of cash payments, also down from 2019, increased by one payment from 2020 to seven. As noted above, this is the first time since 2016 the number of cash payments increased compared to the prior year.
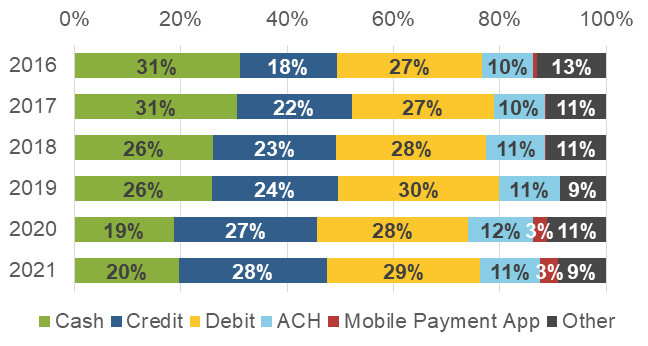
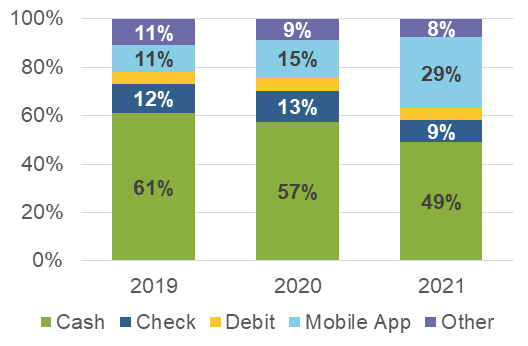
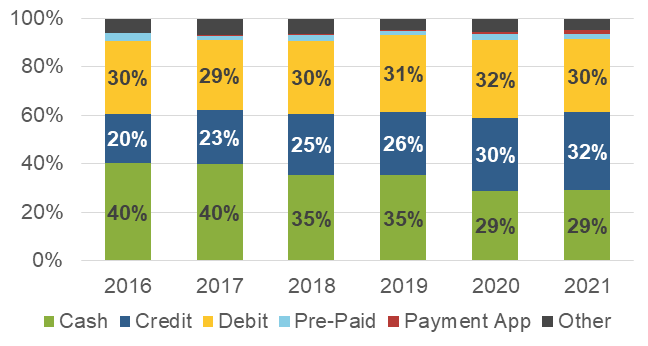
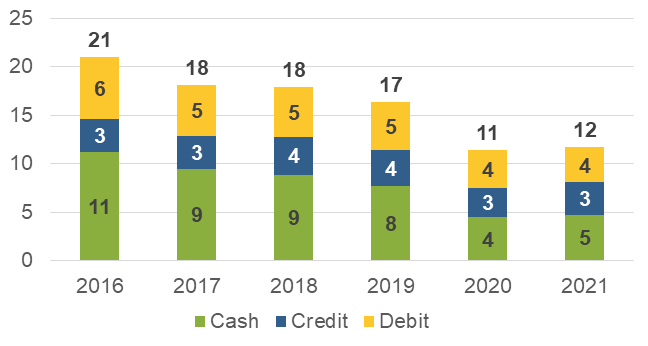
Consumers continued to use credit cards and debit cards for a majority of their payments, accounting for 57 percent of total payments in 2021 compared to 55 percent in 2020 and 54 percent in 2019 (Figure 1). This increased share of card use was because the number of cash payments declined from 10 in 2019 to 7 in 2021 and not because card use increased. In absolute terms, the aggregate number of card payments (debit and credit) declined from 23 payments in 2019 to 21 payments in 2021.
Figure 1
Share of payments use for all payments
(by number)
Factors in the Decline in Cash Use
The decrease in the share of cash use during the pandemic is the result of the following factors:
- Consumers shopped less in person resulting in a lower share of in-person payments overall and fewer opportunities to use cash in 2020 and 2021 compared to 2019.
- Fewer consumers reported a preference for using cash when making payments in person, reducing cash use for in-person purchases and P2P payments.5
- Use of P2P payment apps increased which caused fewer hand-to-hand P2P payments.
- The change in everyday shopping habits resulted in fewer small-value payments of less than $25 in 2020 and 2021 compared to 2019.
Consumers shopped less in person, decreasing the share of in-person payments
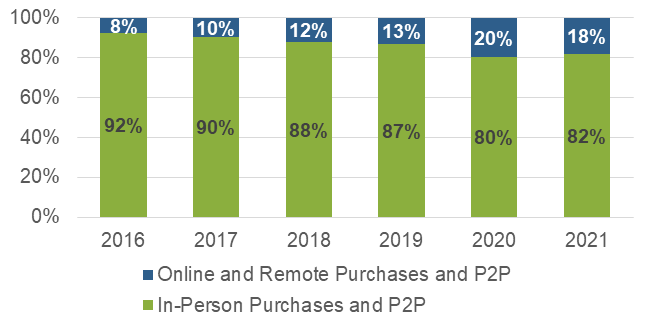
Although most payments are made in person, the share of online purchases and P2P payments6 as a percentage of all purchases and P2P payments remains well above pre-pandemic levels.7 The share of purchases and P2P payments conducted in person increased slightly from 80 percent in 2020 to 82 percent in 2021 (Figure 2). This increase in the share of in-person purchases in 2021 compared to 2020 can be attributed to an increase in the number of in-person purchases. The number of online and remote purchases did not change.8 Nevertheless, the 23 in-person purchases in 2021 remained below the 27 in 2019.
Figure 2
Percentage of purchases and P2P payments made in-person versus online or remote
Remote and online purchases of prepared foods and groceries were a factor in this changed shopping behavior.9 In 2020, one of the largest shifts in shopping behavior was a decrease in the number of in-person payments at fast food and coffee shops, sit-down restaurants and bars, and grocery and conveniences stores (Figure 3). Before the pandemic, remote payments to these merchant types were uncommon. In 2021, the average number of remote payments to these merchants were equivalent to 2020 levels (Figure 4) while the average number of in-person payments increased in 2021, but not back to pre-pandemic levels.
Figure 3
Average number of in-person payments
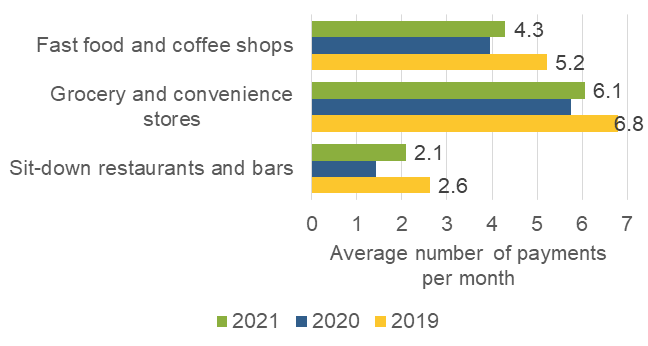
Figure 4
Average number of remote payments
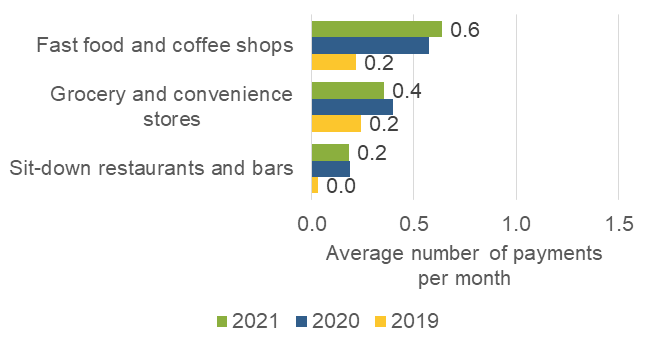
The consistent uptick in remote payments for food at home and away implies that some consumers have not yet or may not resume in-person payments for these merchants and signal a change in consumer shopping preference. And while the initial shift to online payments may have been driven by necessity, consumers in 2021 may have become accustomed to making and to enjoying the benefits of ordering ahead or saving time on shopping.
Consumers increased use of mobile apps to pay another person
While the average number of P2P payments has remained consistent at approximately 1.5 payments over the last three years, consumers have reduced the share of cash payments and increased their use of mobile payment apps (mobile apps). The share of P2P payments made with mobile apps nearly doubled from 2020, increasing from 15 percent in 2020 to 29 percent in 2021. The share of cash use fell below 50 percent for the first time since 2016. Figure 5 shows that although consumers still rely on cash for P2P payments, the shift toward mobile app payments and away from cash accelerated as the pandemic continued.
Figure 5
Person-to-person payments by payment share
Decline in stated preference leads to less cash use in person
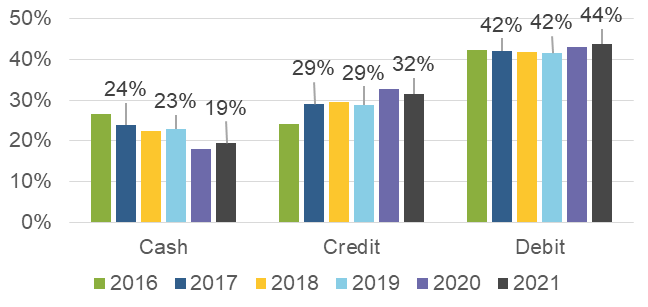
In 2021, one in five consumers stated a preference to pay with cash for in-person payments. Since 2016 the share of consumers who state a cash preference has dropped from 27 percent to 19 percent. Figure 6 shows that decline was accelerated by the pandemic, with the percentage of those preferring cash dropping from 23 percent in 2019 to 19 percent in 2021, a statistically significant decline. The 2020 drop in the share of consumers preferring cash corresponded with an increase in the share of consumers preferring credit cards.
Figure 6
Payment instruments preferred for in-person payments
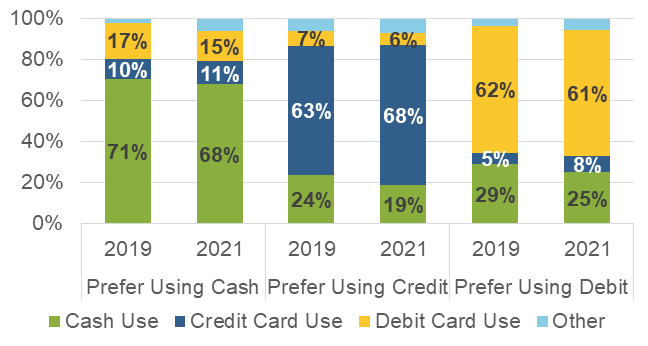
Consumers who preferred cards continued to use cash as their second-most-used payment, though less than in 2019 (Figure 7). The data suggests preferences are sticky and consumers used their preferred payment instrument for over 60 percent of all purchases. Regardless of their payment preferences, consumers shifted their payment use away from cash toward credit cards.
Figure 7
Share of in-person purchases and person-to-person payments by in-person payment preference
Figures 6 and 7 show the importance of these changes in preference. Between 2019 and 2021, all consumers reduced their share of cash use for in-person payments and increased their share of credit card use. This explains why the share of in-person credit card use increased more than six percentage points since the start of the pandemic (Figure 8). However, this was primarily due to a decrease in the number of cash payments from ten to seven rather than the increase in the number of credit card payments from seven to eight.
Figure 8
Share of payments use for in-person payments
Change in habits could be related to fewer small-value payments
The decline in the number of payments under $25 is the main reason both total payments and cash payments declined since 2019 (Figure 9). Changes to everyday habits like stopping for a cup of coffee on the way into work or eating out are likely a significant contributor to this decline. However, the number of such small-value cash payments is unlikely to increase to pre-pandemic levels, because the number of in-person payments under $25 has decreased in almost every year since 2016.
Figure 9
Average number of in-person payments per month under $25
In addition, in 2020 and 2021, consumers used cash less often for small-value payments. In 2019, cash accounted for eight of the 17 small value payments, or 47 percent. In 2021, consumers used cash for five out of 12 small value payments, or 40 percent. This decrease in the share of cash use shows consumers shifted their payment use away from cash and toward cards.
Cash Use by Demographics
Consumers under 25 decreased cash use in favor of card payments
Consumers reduced their shares of cash use across all ages by a statistically significant amount compared to 2019 (Figure 10). Consumers younger than 45 used cash for less than 20 percent of payments; older consumers used cash for more than 20 percent.
Figure 10
Shares of cash use by age group
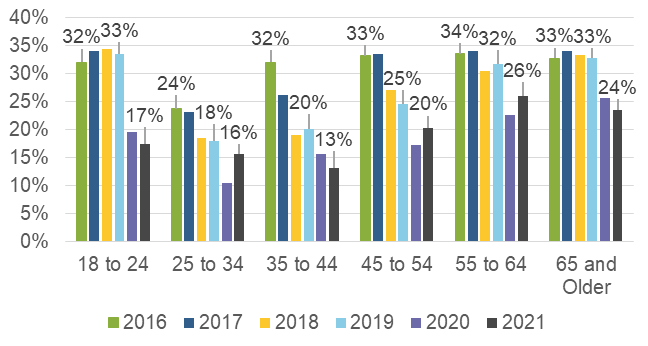
The decline in cash use was most notable for the youngest consumers. Before 2020, consumers under 25 used cash for about one-third of their payments. Between 2019 and 2021, the share fell by almost half to 17 percent, the largest change of any age cohort. This decrease in the share of cash use for those under 25 resulted from two factors: they made fewer cash payments, eight in 2019 and five in 2021, and more card payments, 11 in 2019 and 15 in 2021. While it is not clear that the 17 percent share of cash use for those under 25 will persist, the substitution between their cash and card use suggests this cohort’s cash use is unlikely to return to pre-pandemic levels.
Consumers in lower income households continued to rely on cash for payments
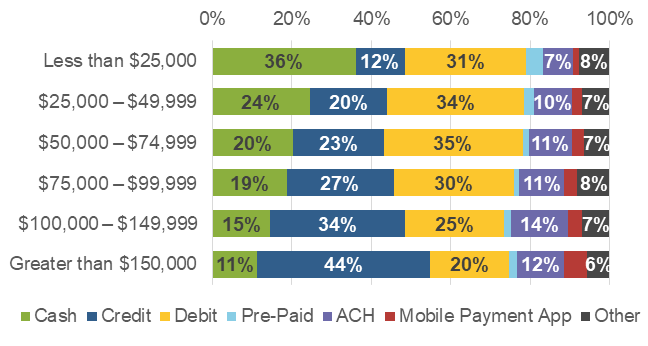
Use of cash use is correlated with a consumer’s household income. On average, consumers in households with lower income have a higher share of cash use than those in higher income households. In 2021, the share of cash use for consumers in households making less than $25,000 was approximately three times higher (36 percent) than that of those living in households making more than $150,000 (11 percent) (Figure 11). The relationship between household income and cash use predates the pandemic and has persisted through 2021.
Figure 11
Shares of payment instrument use by household income
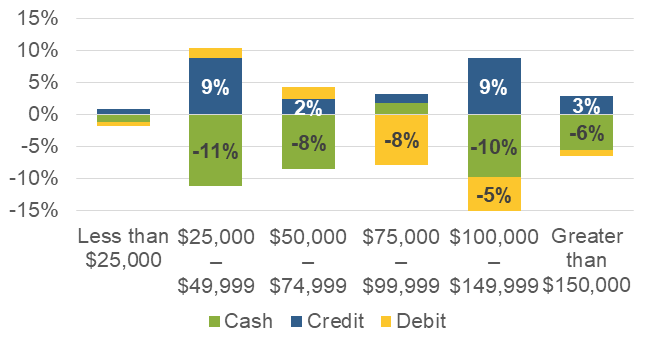
Consumers in households making less than $25,000 not only relied heavily on cash but also did not change their mix of payment instruments during the pandemic (Figure 12). Their share of payments by cash, debit card, and credit card are nearly identical for 2019 and 2021, suggesting that these individuals are less willing—or less able—to substitute credit or debit card payments for cash. This year-over-year consistency strongly suggests that a significant portion of the population relies on cash to make everyday payments, even during a pandemic.
Figure 12
Percentage point change in payment use from 2019 to 2021 by Household Income
Trends in Cash Holdings
Between October 2016 and October 2019, the value of currency in circulation increased approximately $300 billion, an average of seven percent annually. During the time of the pandemic, from October 2019 to October 2021, the value of currency in circulation increased by more than $423 billion, or 12 percent annually.10
On-person cash holdings decline towards pre-pandemic levels
Cash held in a consumer’s pocket, purse, or wallet (on-person holdings), typically available for in-person payments, was stable at around $60 from 2016 to 2019. On-person cash holdings grew 25 percent to $76 in the first pandemic year and then fell back to $67 in 2021 (Figure 13).11 The decline in on-person holdings in 2021 was observed across all age and income cohorts (Figures 13 and 14). The return toward to pre-pandemic levels of on-person holdings suggests the additional on-person holdings in 2020 were temporary and kept as a back-up payment instrument for emergencies.12,13
Figure 13
Average daily on-person holdings by age
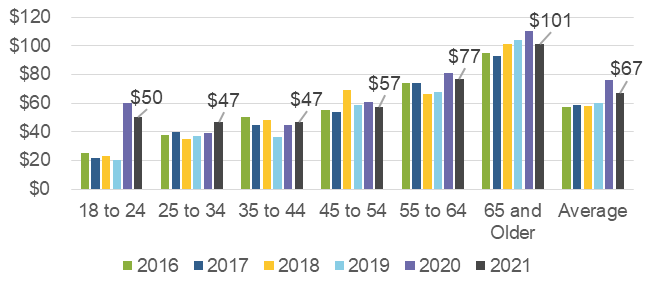
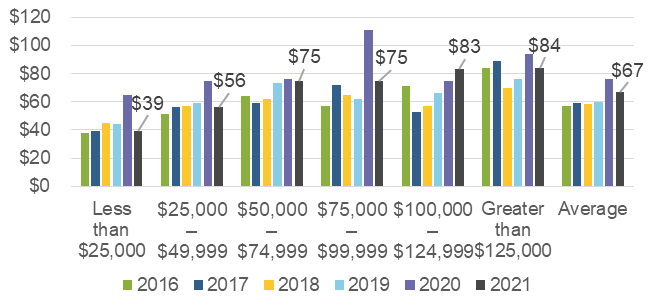
Figure 14
Average daily on-person holdings by household income
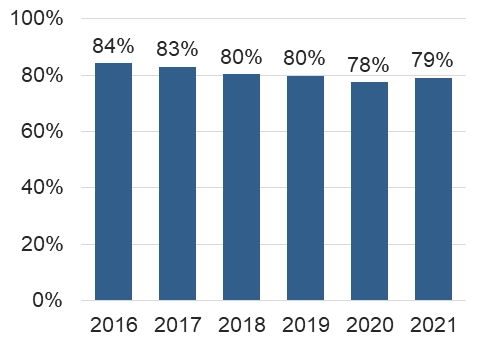
The share of consumers holding on-person cash has remained consistent since 2018, with 8 in 10 adults holding cash at least once during the Diary (Figure 15).14 This consistency suggests that most adults prefer to have some cash on hand—both in normal years and in unusual years.
Figure 15
Share of adults holding on-person cash at least one day
Store-of-value holdings remain elevated throughout the pandemic
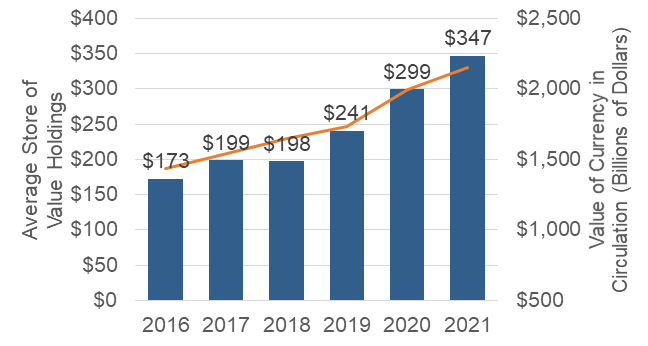
In contrast to the average value of on-person holdings, the average value of cash held in one’ store-of-value holdings (cash held in one’s home, car, or elsewhere) continued its increase in October 2021, reaching $347 (Figure 16).15 As Figure 16 shows, consumers’ average store-of-value holdings have increased more rapidly since 2018; with increases of 22% in 2019, 24% in 2020, and 20% in 2021. The significant increase in the average value held since 2019 shows aggregate demand for U.S. currency increased during times of uncertainty. While consumers have reported an increase in store of value holdings since 2016, the significant increase in the average value held since 2019 shows aggregate demand for U.S. currency increases during times of uncertainty.
Figure 16
Average store of value holdings
Conclusion
This year’s Diary was conducted when the average number of COVID-19 infections per day in the U.S. ranged from nearly 110,000 on October 1, 2021, to approximately 72,000 on October 31, 2021.16 In conjunction with the October 2020 Diary and supplemental surveys, the findings of the 2021 Diary reflect the continued impact of the pandemic on consumer payment behavior. While total payments, cash payments, and the number of in-person payments in 2021 all increased compared to 2020, these increases were not statistically significant. Other important metrics, such as the average value of cash holdings and the share of individuals making in-person payments, continued to increase compared to October 2020.
A key finding from this year’s study is that cash use decreased, and credit card use increased for consumers across all household income levels throughout the pandemic. The one exception was for consumers with household incomes less than $25,000, whose cash use has been consistent leading up to and throughout the pandemic. These consumers make up nearly 20 percent of the U.S. population, so a significant portion of the U.S. adult population remains dependent on cash for everyday payments.
Appendix
About the Diary of Consumer Payment Choice
The Diary studies provide vital insights into how consumer payments may be changing from one year to the next. This ensures FedCash Services are fulfilling the mission of meeting demand in times of normalcy and stress, maintaining the public’s confidence in U.S. currency, and providing ready access to cash. Understanding the evolving role of cash in the economy is critical to fulfilling that mission.
Federal Reserve Financial Services uses data from the Diary to understand consumer cash use and anticipate its ongoing role in the payments landscape. Developed by the Federal Reserve Bank of Boston’s Consumer Payment Research Center (CPRC) and currently managed by the Research Department at the Federal Reserve Bank of Atlanta, the Diary collects data about shopping and payments behavior from a unique, nationally representative survey of consumers administered by the University of Southern California (USC) Dornsife Center for Economic and Social Research. USC’s Understanding America Study panel of households comprises approximately 9,000 respondents from across the United States, 4,674 of which completed the 2021 Diary.
To ensure a nationally representative sample, responses are weighted to match national population estimates based on the Census Bureau’s Current Population Survey. The Diary is administered throughout the month of October, which was selected as a “typical month” to minimize seasonality effects in consumer spending patterns. Participants were each assigned a three-day period within the month, with some individuals assigned a starting date in late September and others assigned to finish in early November. For a more detailed description of the Diary of Consumer Payment Choice, see Angrisani, Foster, and Hitczenko (2017b); Angrisani, Foster, and Hitczenko (2018); Greene, Schuh, and Stavins (2018); Greene and Schuh (2017); Greene, O’Brien, and Schuh (2017); and Schuh (2017).
By tracking consumer payment transactions and preferences annually during the month of October, Federal Reserve Financial Services compares cash with other payment instruments, such as debit and credit cards, checks, and electronic options. Diary participants also report the amount of cash on hand after each survey day, cash stored elsewhere, and cash deposits or withdrawals. The Diary data is then analyzed, including the impact of age and income on an individual’s payment behavior and preferences. This detail of the stock and flow of cash at an individual level provides insight into how consumers use cash.
About FedCash® Services
As the nation’s central bank, the Federal Reserve ensures that cash is available when and where it is needed, including in times of crisis and business disruption, by providing FedCash Services to depository institutions and, through them, to the general public. In fulfilling this role, the Federal Reserve’s primary responsibility is to maintain public confidence in the integrity and availability of U.S. currency.
FedCash Services provides strategic leadership for this key function by formulating and implementing service level policies, operational guidance, and technology strategies for U.S. currency and coin services provided by Federal Reserve Banks nationally and internationally. In addition to guiding policies and procedures, FedCash Services establishes budget guidance, provides support for Federal Reserve currency and coin inventory management, and supports business continuity planning at the supply chain level. It also conducts market research and works with financial institutions and retailers to analyze trends in cash usage.
References
Angrisani, Marco, Kevin Foster, and Marcin Hitczenko. 2017b. “The 2012 Diary of Consumer Payment Choice: Technical Appendix.” Federal Reserve Bank of Boston Research Data Reports No. 17-5.
Angrisani, Marco, Kevin Foster, and Marcin Hitczenko. 2018. “The 2015 and 2016 Diaries of Consumer Payment Choice: Technical Appendix” Federal Reserve Bank of Boston Research Data Reports No. 18-2.
Coyle, Kelsey, Laura Kim, and Shaun O’Brien. 2021. “2021 Findings from the Diary of Consumer Payment Choice.” Cash Product Office, Federal Reserve System, May.
Coyle, Kelsey, Laura Kim. and Shaun O’Brien. 2021. “Consumer Payments and the COVID-19 Pandemic: The Second Supplement to the 2020 Findings from the Diary of Consumer Payment Choice.” Cash Product Office, Federal Reserve System, July.
Foster, Kevin and Claire Greene. 2021. “Consumer Behavior in a Health Crisis: What Happened with Cash?” Policy Hub, 1, pp.17–39.
Greene, Claire, and Scott D. Schuh. 2017. “The 2016 Diary of Consumer Payment Choice.” Federal Reserve Bank of Boston Research Data Reports No. 17-7.
Greene, Claire, Shaun O’Brien, and Scott Schuh. 2017. “U.S. Consumer Cash Use, 2012–2015: An Introduction to the Diary of Consumer Payment Choice.” Federal Reserve Bank of Boston Research Data Reports No. 17-6.
Greene, Claire, Scott D. Schuh, and Joanna Stavins. 2018. “The 2012 Diary of Consumer Payment Choice: Summary Results.” Federal Reserve Bank of Boston Research Data Reports No. 18-1.
Kim, Laura, Raynil Kumar, and Shaun O’Brien. 2020. “2020 Findings from the Diary of Consumer Payment Choice.” Cash Product Office, Federal Reserve System, July.
O’Brien, Shaun. 2021. “Consumer Payments and the COVID-19 Pandemic: Findings from the April 2021 Supplemental Survey.” Cash Product Office, Federal Reserve System, September.
Schuh, Scott. 2017. “Measuring Consumer Expenditures with Payment Diaries.” Federal Reserve Bank of Boston Research Department Working Papers No. 17-2.
The financial services logo and “FedCash” are registered service marks of the Federal Reserve Banks. A list of marks related to financial services products that are offered to financial institutions by the Federal Reserve Banks is available at www.FRBservices.org.
Footnotes
1. The first Diary study took place in 2012 using RAND’s American Life Panel. The second Diary study took place in 2015 and used both USC’s Understanding America Study panel and Growth from Knowledge panel. The 2015 Diary took place between October 15th and December 15th. This is the reason why the 2016 Diary is referred to as the first annual Diary study that takes place in the month of October.
2. See Consumer Payments and the COVID-19 Pandemic: A Supplement to the 2020 Findings from the Diary of Consumer Payment Choice – Cash (frbsf.org), Consumer Payments and the COVID-19 Pandemic: The Second Supplement to the 2020 Findings from the Diary of Consumer Payment Choice – Cash (frbsf.org), and Consumer Payments and the COVID-19 Pandemic: Findings from the April 2021 Supplemental Survey – Cash (frbsf.org)
3. The supplemental COVID-19 surveys were recall based surveys asking individuals to report on current cash holdings and their payment and shopping behavior over the last 30 days.
4. Payments include all bill and non-bill payments as well as in-person, remote, and online payments reported by Diary participants.
5. The decrease in the share of cash use in 2020 and 2021 when compared to 2019 is a statistically significant decrease and corresponds with an increase in the share of credit card use.
6. Payments are defined as bill payments, purchases, and P2P payments. The phrase purchases and P2P payments exclude bill payments.
7. Bill payments are excluded from the analysis in this section.
8. Online and remote payments are payments participants reported as “not-in-person.” Examples of this include making a purchase on a phone, tablet, or computer or even reading one’ card number to a retailer over the phone.
9. See Cash | Publications (frbsf.org), Atlanta paper TK
10. Currency in Circulation (CURRCIR) | FRED | St. Louis Fed (stlouisfed.org)
11. Cash | Consumer Payments and the COVID-19 Pandemic: Findings from the April 2021 Supplemental Survey (frbsf.org) On-person holdings may differ from the Diary tables reported by the Atlanta Federal Reserve as the on-person holding reported here are truncated at the 99th percentile.
12. The average number of cash back and ATM withdrawals increased from 1.1 withdrawals in 2020 to 1.5 in 2021, though this difference was not significant. The average value of ATM withdrawals increased by $12, and the average value of cash back at retail stores decreased from $60 to $36, though these differences were also not statistically significant.
13. Cash withdrawals are any transactions where the participant acquires cash. This can be at an ATM, depository institution branch, cash back at a retail location, check cashing store, pay day lenders, or from family members.
14. Cash holdings are reported on four consecutive days, participants three diary days as well as holdings the day before.
15. Consumer Payments and the COVID-19 Pandemic: Findings from the April 2021 Supplemental Survey (frbsf.org)
16. Covid in the U.S.: Latest Maps, Case and Death Counts – The New York Times (nytimes.com)