

Brigitte Roth Tran, senior economist at the Federal Reserve Bank of San Francisco, stated her views on the current economy and the outlook as of March 7, 2024.
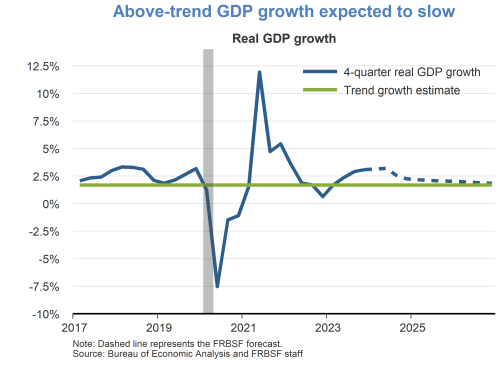
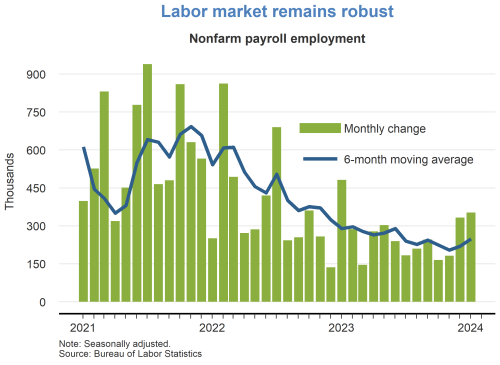
- Recent developments continue to support a “soft landing” for the economy, which means inflation returning to the Federal Reserve’s longer-run goal of 2% without triggering a recession. The labor market remains robust with the January 2024 unemployment rate holding steady at 3.7%, and nonfarm payroll employment rising by 353,000 jobs. Real GDP grew at a solid pace of 3.2% in the fourth quarter of 2023. Given the current restrictive stance of monetary policy, we expect real GDP growth to slow towards our 1.7% estimate of trend growth over the forecast horizon.
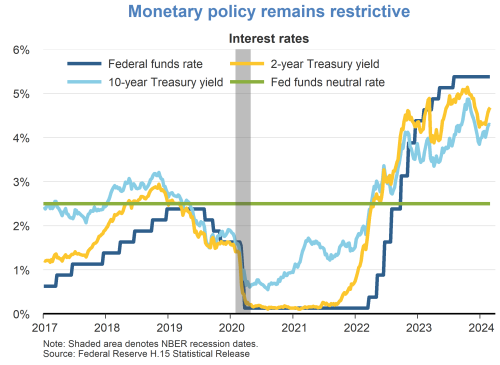
- From March 2022 through July 2023, the Federal Open Market Committee (FOMC) increased the federal funds rate eleven times in response to elevated inflation. Since July 2023, the federal funds rate has remained between 5.25 and 5.5%. This level of the funds rate is well above our 2.75% estimate of the neutral rate and is expected to restrain economic activity and bring about a gradual decline of inflation towards 2%.
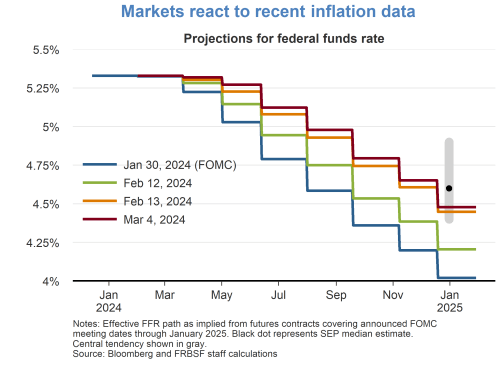
- Market participants have adjusted their expectations of the federal funds rate path in response to recent inflation developments. The expected path shifted upward after the February 13 release of the Consumer Price Index (CPI) data for January 2024 and has changed little since then. The upward shift implies that market participants now expect monetary policy to remain somewhat more restrictive during 2024.
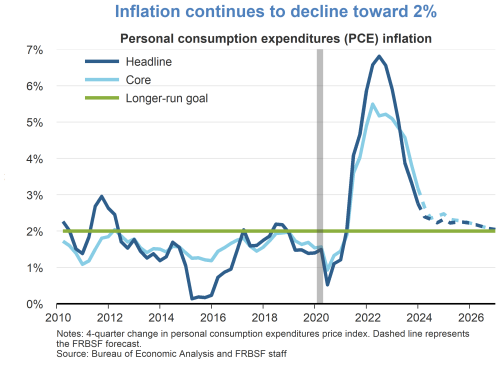
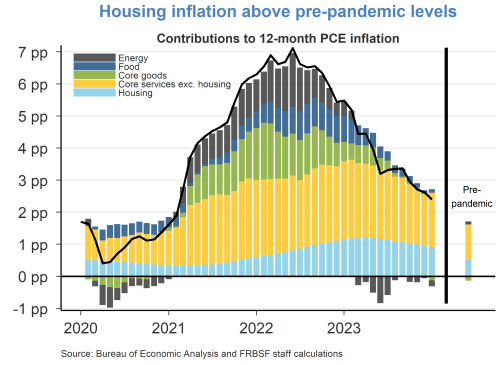
- After peaking in June 2022 at 7.1%, the 12-month change in the headline personal consumption expenditures (PCE) price index declined to 2.4% in January 2024. Much of this decline can be attributed to lower inflation contributions coming from the food, energy, and core goods categories. In contrast, the inflation contributions coming from housing and other core services categories remain above pre-pandemic levels.
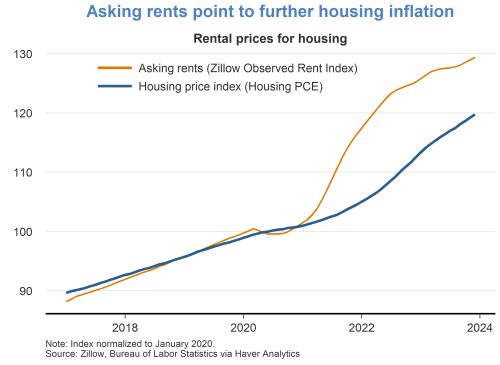
- The housing category of PCE inflation reflects changes in average rents for the entire stock of housing units in the economy. In contrast, the Zillow Observed Rent Index measures the asking rents that landlords are currently seeking for new leases of rental units. In an environment where asking rents are rising, average rents for the entire housing stock take some time to fully reflect such changes. This occurs because rents for existing leases are generally fixed for the duration of each lease. Thus, it is not until existing tenants move or renew their leases that they typically face rent increases that ultimately drive up average rents.
- The Zillow index shows that asking rents climbed rapidly from early 2021 through the first half of 2022 but have since slowed to a more moderate pace. The PCE housing inflation component is likely to remain above its pre-pandemic level for some time as the measure for average rents adjusts to catch up with higher asking rents.
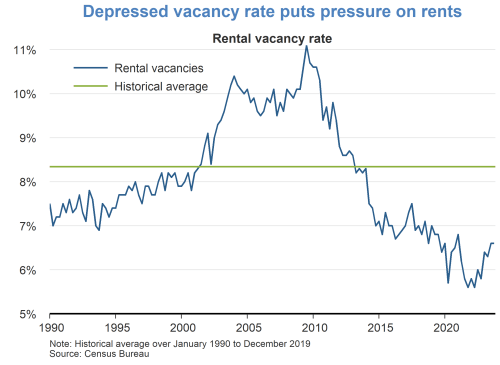
- The vacancy rate for the entire stock of rental units in the United States was 6.6% in the fourth quarter of 2023. This vacancy rate is well below the average rate observed in the 25 years prior to 2020. A low vacancy rate indicates that rental markets are tight as units that open up are leased quickly. A low supply of available rental units puts upward pressure on asking rents. This is another reason that the housing category of PCE inflation may remain elevated for some time. Unlike some other sectors of the U.S. economy where supply can often ramp up quickly in response to increased demand, housing supply is relatively inelastic because construction of new units from start to finish can take years.
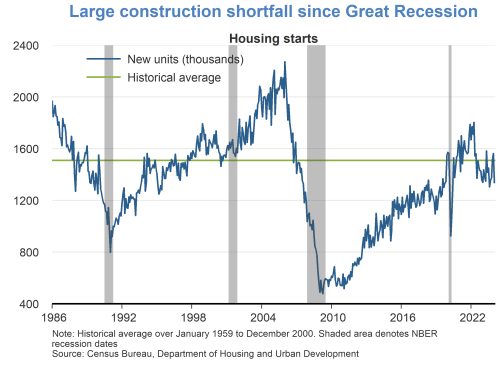
- The sluggish response of housing supply to rising demand can be seen in the large post-Great Recession shortfall of new housing starts relative to the historical average. Part of the reason for this shortfall was the substantial overbuilding that took place during the housing bubble years of the mid-2000s, when starts reached a peak rate of over 2 million units annually in early 2006. After declining for several years, starts began a slow recovery but did not return to the historical average rate of about 1.5 million units annually until 2019. The cumulative shortfall in new housing starts since the end of the Great Recession now outweighs the entire surplus of starts during the housing bubble years.
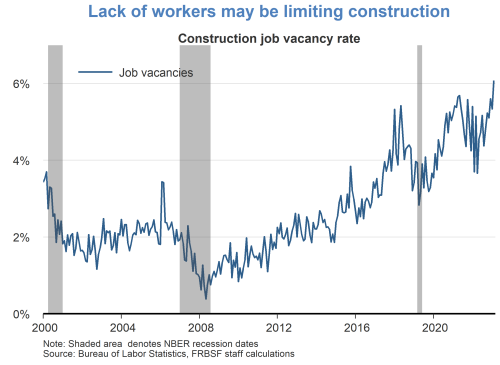
- The shortfall in new housing starts is likely due to a number of contributing factors. These include the limited availability of developable land where demand is strongest and the high cost of construction materials like lumber. Another contributor may be the limited supply of construction workers. The job vacancy rate in the construction sector was 5.5% in December 2023, which is close to its historical high. These data suggest that builders are facing difficulties finding and hiring the qualified workers needed to expand production. The construction sector’s labor situation may be slow to resolve because many construction tasks require specialized skills that can take a long time to acquire.
Charts were produced by River Bell.
About the Author
Brigitte Roth Tran is a senior economist in the Economic Research Department of the Federal Reserve Bank of San Francisco. Learn more about Brigitte Roth Tran
The views expressed are those of the author, with input from the forecasting staff of the Federal Reserve Bank of San Francisco. They are not intended to represent the views of others within the Bank or within the Federal Reserve System. This publication is edited by Kevin J. Lansing and Karen Barnes. FedViews appears eight times a year, generally around the middle of the month. Please send editorial comments to Research Library.