

Daniel Wilson, vice president at the Federal Reserve Bank of San Francisco, stated his views on the current economy and the outlook as of June 5, 2025.
Recent data have sent mixed signals on the outlook for both inflation and real economic activity. Readings on inflation over the past year point to an uneven, but generally downward, trend towards the Federal Reserve’s 2% goal. However, household expectations for inflation have risen sharply in the past two months. So-called “hard data” on real economic activity, such as GDP growth, consumer spending, and employment, remain generally solid. Yet, “soft data,” such as measures of sentiment and uncertainty, have deteriorated significantly, raising risks of an economic slowdown ahead.
Inflation expected to rise in the near term, then resume progress towards 2%
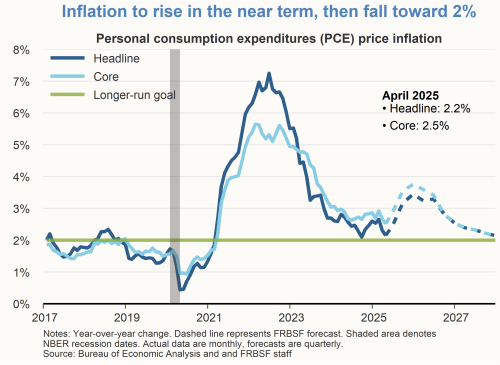
Both headline and core inflation have eased substantially since their post-pandemic peaks in mid-2022, moving closer but unevenly towards the Federal Reserve’s 2% goal. Headline and core inflation in April were 2.1 and 2.5%, respectively, compared with 2.5 and 2.8% for the first quarter as a whole. However, we expect inflation to rise notably over the next two to three quarters in response to higher tariff rates that push up input costs and final prices. Downward progress on inflation is expected to resume next year. The future path of inflation remains uncertain and depends on the final scope, scale, and duration of trade policy adjustments.
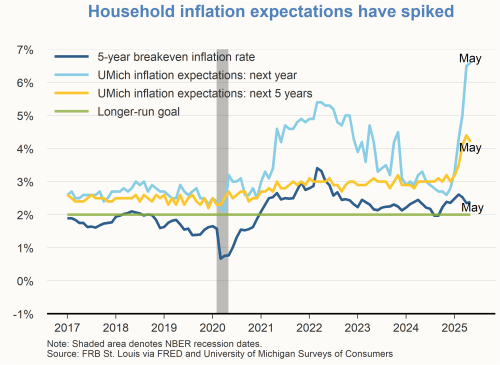
Household inflation expectations have increased sharply over the past three months, both at the one-year and five-year ahead horizons, according to the University of Michigan Surveys of Consumers. In contrast, market-based measures of inflation expectations, such as breakeven rates on Treasury Inflation-Protected Securities (TIPS) have remained subdued and consistent with the Fed’s 2% inflation goal.
Hard data remain solid
Economists often distinguish between “hard” and “soft” data. Hard data on the real economy typically refer to readings from official government sources on economic activity, which include consumer spending and industrial production, or readings on production inputs, such as employment, hours worked, or capital investment. These data provide the most comprehensive picture of the strength of the economy at a given time. However, these data are backward-looking and often published with a significant time lag. In contrast, soft data from surveys or less traditional sources can be more forward-looking and are available closer to real time. For this reason, when the economic outlook is particularly uncertain, economists often pay close attention to what soft data are telling us.
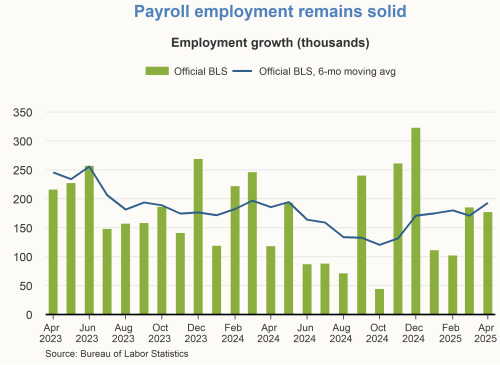
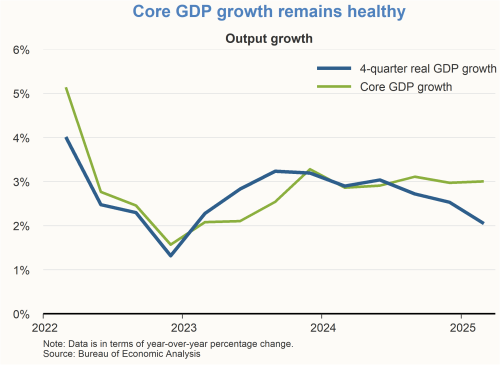
Recent hard data have been mostly solid. For instance, while first-quarter real GDP showed a slight decline from the previous quarter, much of the drop reflected a surge in imports in response to anticipated tariffs, thereby subtracting from the calculation of total GDP. “Core” GDP, defined as the sum of consumer spending and gross private fixed investment, may provide a more accurate gauge of underlying economic activity at the moment. Growth in core GDP has been steady over the past year at around 3.0%. Labor market indicators also remain solid. Payroll employment growth has averaged roughly 190,000 net new jobs per month over the past six months, and the unemployment rate, at 4.2% in April, remains close to estimates of the natural rate of unemployment.
Soft data on sentiment and uncertainty have deteriorated
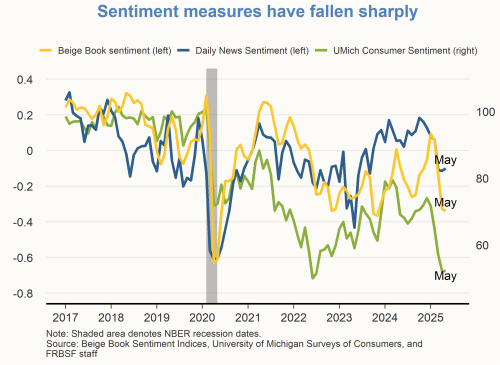
Soft data have been telling a different story of late. Two examples of soft data are measures of sentiment and uncertainty. Several sentiment indexes have declined sharply in recent months. These include the University of Michigan’s Consumer Sentiment Index, the SF Fed Daily News Sentiment Index, and a Beige Book sentiment measure.
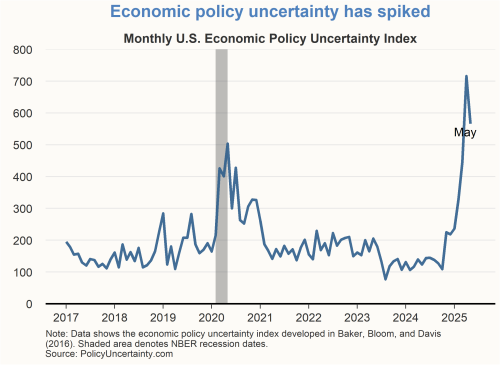
Over the same time frame, some measures of uncertainty have jumped. For example, the monthly Economic Policy Uncertainty (EPU) Index spiked in April to its highest level on record, going back to the year 1900. The index receded somewhat in May but remains quite elevated.
Financial conditions have been volatile

Financial markets have been volatile in recent months, coinciding with heightened policy uncertainty. After falling sharply in March and April, the S&P 500 index has rebounded in recent weeks and is nearing its beginning-of-year level. This recent upward movement in the S&P 500 index could bolster sentiment and consumer spending in the near term. Treasury yields have also followed a volatile trajectory this year.
Some measures of recession risk have risen
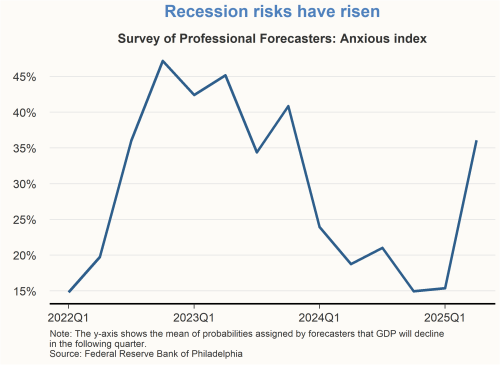
Overall, recent data paint a mixed picture for the economic outlook, with hard data remaining mostly solid, while soft data have deteriorated. As with the data, indicators of recession risk have also been sending mixed results lately. According to the Survey of Professional Forecasters, the probability of a decline in GDP over the next quarter jumped to 37% in May from only 15% in February. Spikes in this series have often preceded past recessions.
However, other recession indicators, such as the Sahm rule (which compares the 3-month moving average of the unemployment rate to its minimum over the past year) and the term spread between 10-year and 3-month Treasury yields are currently not signaling a recession. It will be important to closely monitor these and other recession forecasting tools over the months ahead.
Charts were produced by Shane Boyle.
The views expressed are those of the author with input from the Federal Reserve Bank of San Francisco forecasting staff. They are not intended to represent the views of others within the Bank or the Federal Reserve System. This publication is edited by Kevin J. Lansing, Karen Barnes, and Hamza Abdelrahman. SF FedViews appears eight times a year. Please send editorial comments to Research Library.