

Andrew Foerster, senior research advisor at the Federal Reserve Bank of San Francisco, shared views on the current economy and the outlook from the Economic Research Department as of September 4, 2025.
While economic activity in the United States has remained resilient, recent data show some softening in the labor market. Swings in net exports affected GDP in the first half of 2025, with imports surging in the first quarter followed by imports declining in the second quarter. Inflation remains above the Fed’s 2% goal, and a near-term rise from tariffs appears likely. Job gains in recent months have slowed. Downward revisions for recent job growth estimates have been large, but the magnitudes of these revisions are not out of line with historical values. Job growth estimates remain reliable despite data collection challenges. With the balance of risks surrounding the Fed’s dual mandate now shifting, market participants are projecting an easing of monetary policy in coming months.
GDP growth affected by swings in net exports
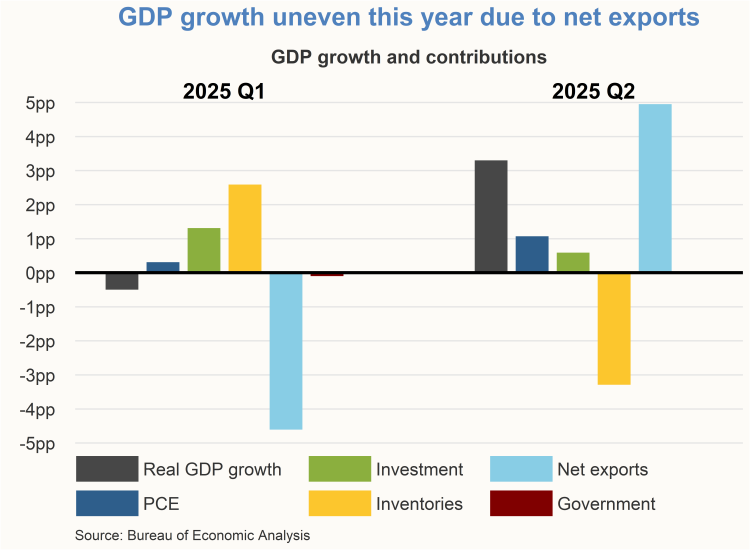
Economic growth fluctuated in the first half of the year, with real GDP contracting slightly in the first quarter followed by solid growth in the second quarter. These movements were affected by outsized swings in net exports, which is the difference between exports and imports. These swings are attributable to the anticipation of tariff increases, and tariff increases going into effect. In the first quarter, net exports reduced real GDP growth during a large inventory buildup. Net exports increased real GDP growth in the second quarter, but inventories declined, delivering a negative contribution to growth.
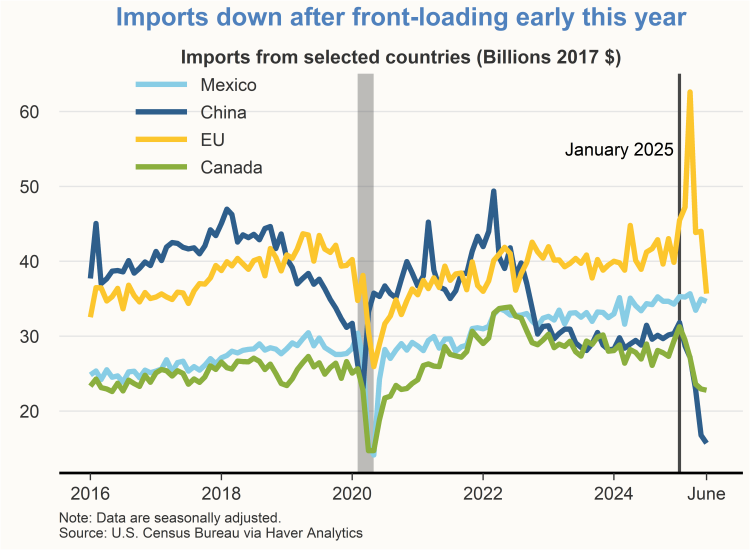
U.S. imports from China and Canada peaked in January and fell precipitously in subsequent months. Imports from the EU saw a substantial run-up in March that was quickly reversed to a lower level. By contrast, imports from Mexico have been relatively stable.
Inflation remains above target
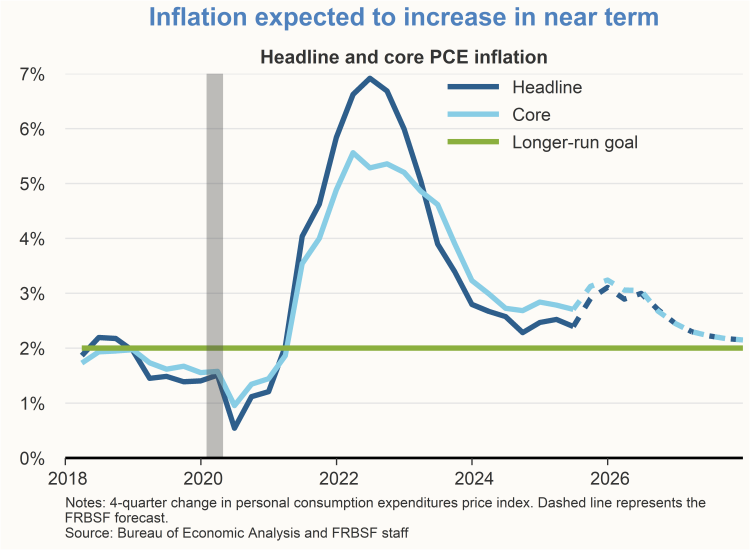
Inflation remains somewhat elevated, and the disinflationary trend that was evident a year ago may have stalled. Inflation measured by the 12-month change in the personal consumption expenditures (PCE) price index was 2.6% in July, The 12-month core PCE inflation rate, which omits volatile food and energy categories, was 2.9% in July. Both inflation measures have seen little change over the last 12 to 18 months, suggesting that progress towards the Federal Open Market Committee (FOMC)’s 2% longer-run goal may have stalled. PCE inflation is expected to rise in coming months as tariff-driven price increases of imported goods filter through the economy.
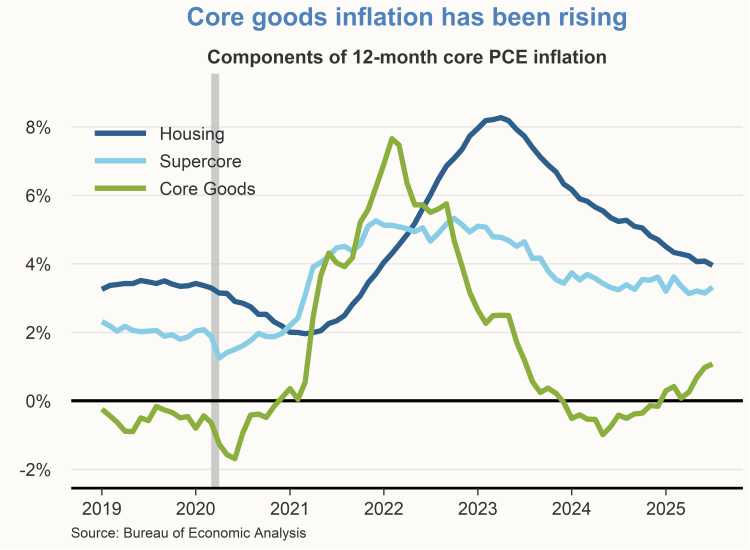
The three elements of 12-month core PCE inflation, namely, core goods inflation, housing inflation, and supercore services inflation, all remain above pre-pandemic typical levels. Core goods inflation has been increasing from slight deflationary levels, and housing inflation has continued its steady decline from the post-pandemic peak. Supercore inflation has budged little since late 2023 and remains stuck at a relatively high level.
Revised data show that job growth has slowed
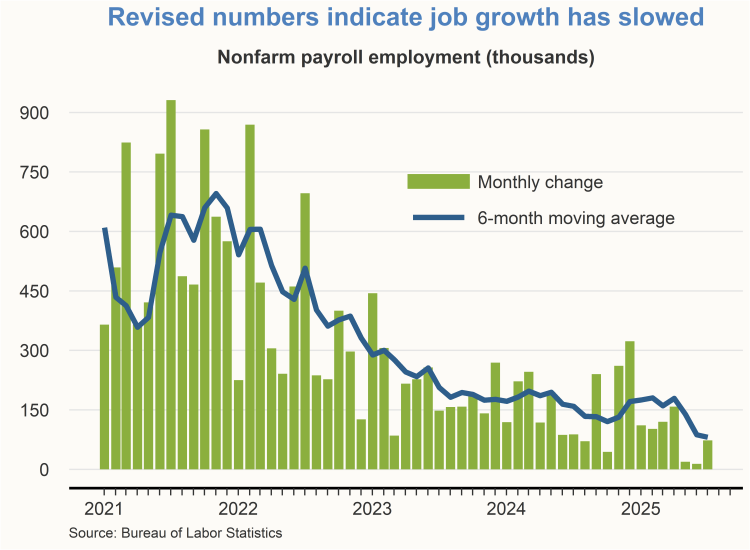
Recent job growth readings show that the labor market has softened somewhat. The U.S. economy created 73,000 new jobs in July, but downward revisions for May and June together totaled 258,000 jobs. Monthly job gains—a measure that has been trending down in recent months—averaged 81,000 over the last six months. At the same time, the unemployment rate has remained low and stable and currently sits at 4.2%.
Payroll growth estimates have remained reliable despite data collection challenges
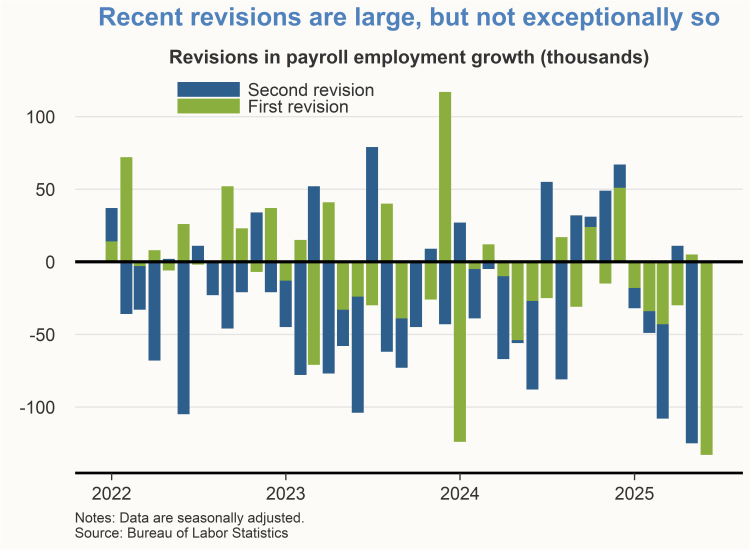
The July 2025 employment report from the Bureau of Labor Statistics (BLS) included a substantial downward revision to the job growth estimates for the previous two months. Revisions to prior estimates are a routine element of every single employment report. For a typical month’s job growth estimate, the initial release is followed by two rounds of revisions released in the two months following the initial release.
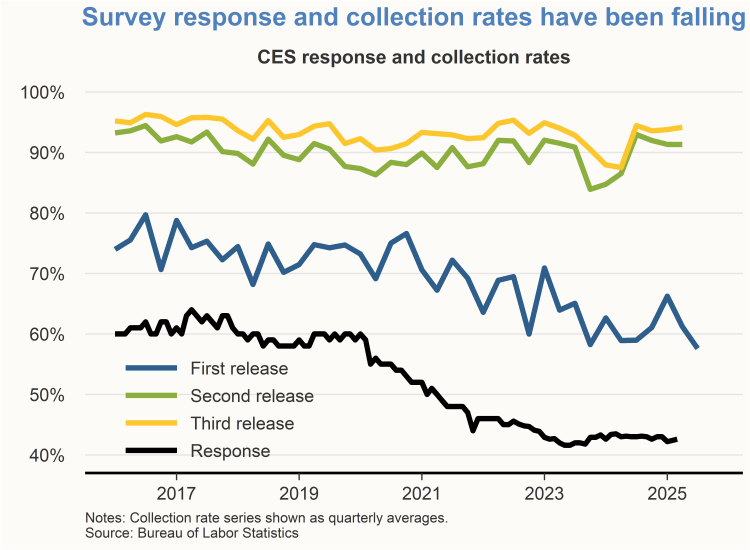
In recent years, and especially since the pandemic, the BLS has faced declining response and collection rates to the establishment survey that is used to estimate job gains. The BLS surveys about 121,000 establishments consisting of businesses and government agencies covering roughly one-fourth of total payroll employment in the U.S. economy. The survey response rate is the fraction of establishments responding to the BLS’s request to participate in the survey. Starting around 2020, the survey response rate declined from around 60% to its current level of about 43%. At the same time, the survey responses are coming in later. The survey collection rate is the fraction of participating establishments that send in their data during a given month. The collection rate for the initial release of the monthly employment report is around 60%, while the collection rates for the second and third releases of the report that feed into subsequent revisions have remained relatively steady at or above 90%. In other words, the initial employment report for a given month is based on a smaller number of submitted responses from establishments. This pattern implies more scope for subsequent revisions as delayed responses from establishments come in and are incorporated into the second and third estimates of job growth for a given month.
Despite the changing response and collection rates from surveys that feed into revisions, monthly job growth estimates remain reliable. So far in 2025, the revisions to job growth between the initial and second releases of the employment report for a given month have been mostly downward. This pattern implies that the initial release tended to overstate job growth. A series of mostly downward revisions can be symptomatic of a softening labor market, as additional incoming data reveals the extent of slowing job gains.
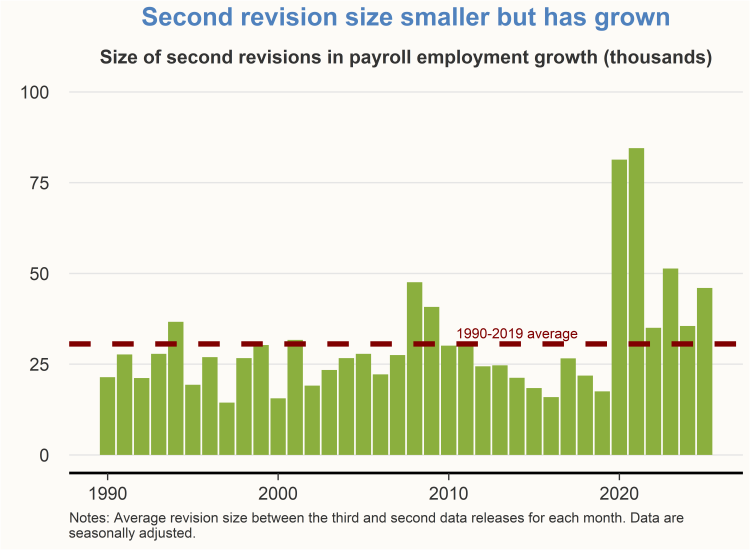
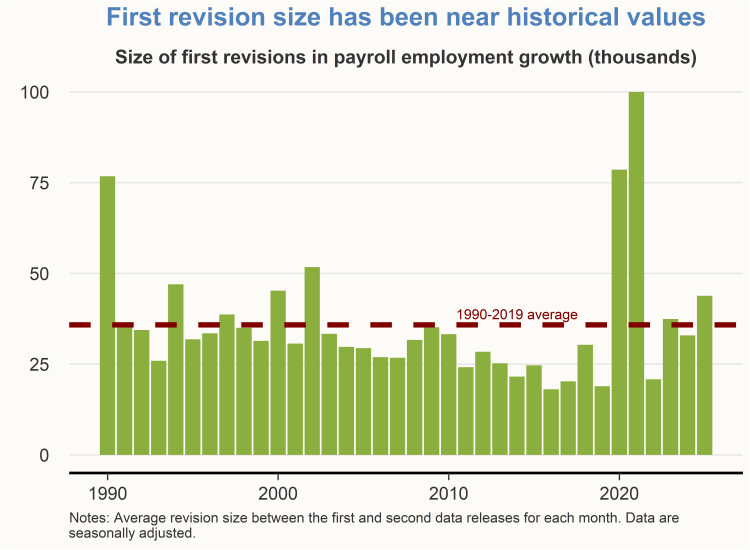
The size of the recent revisions to monthly job growth numbers remains in line with longer-run historical averages. Revisions in 2020 and 2021 were relatively large due to the unprecedented economic impacts from the pandemic. But since 2022, the average size of revisions from the initial to the second release (the first revision) has been roughly the same as the 1990–2019 average. The average size of the revision from the second to the third release (the second revision) has ticked up since 2022, but by only a small amount.
Financial markets expect an easing in monetary policy
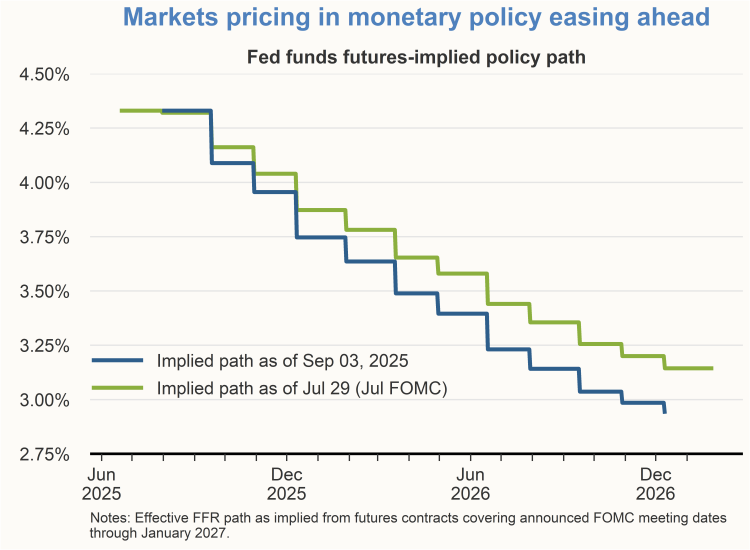
The FOMC’s target range for the federal funds rate has been unchanged at 4¼ to 4½% for almost a year. Financial market participants are currently projecting an easing in monetary policy in the coming months. At the July 2025 FOMC meeting, the implied path for the funds rate from financial markets was 50 basis points lower than the current funds rate by the end of 2025. This level was consistent with the median of the FOMC’s Summary of Economic Projections (SEP) in June 2025. But since the July meeting, financial market participants are now projecting a funds rate path that is even lower by the end of 2025.
Charts were produced by Sabrina Considine.
The views expressed are those of the author with input from the Federal Reserve Bank of San Francisco forecasting staff. They are not intended to represent the views of others within the Bank or the Federal Reserve System. This publication is edited by Kevin J. Lansing, Karen Barnes, and Hamza Abdelrahman. SF FedViews appears eight times a year. Please send editorial comments to Research Library.