

Huiyu Li, research advisor at the Federal Reserve Bank of San Francisco, shared views on the current economy and the outlook from the Economic Research Department as of September 3, 2026.
The U.S. economy continues to expand at a solid pace, powered by a pickup in labor productivity growth. Real GDP grew at an annualized rate of 1.5% in the second quarter and 2.1% over the last four quarters, in line with our 2% trend growth estimate. Inflation remains above the Fed’s 2% goal. Headline personal consumption expenditures (PCE) inflation reached 3.7% in July, boosted by elevated energy and core goods prices. The labor market remains broadly in balance, but modest employment growth may indicate potential vulnerability. Financial markets now expect the Federal Open Market Committee (FOMC) to raise the federal funds rate to about 4.25% between now and mid-2027, the equivalent of two or three 25 basis point hikes. A key question is whether recent productivity gains reflect lasting benefits from investment in artificial intelligence (AI) or, alternatively, a temporary boost from capital investment and factor utilization.
Inflation rising on higher goods and energy categories
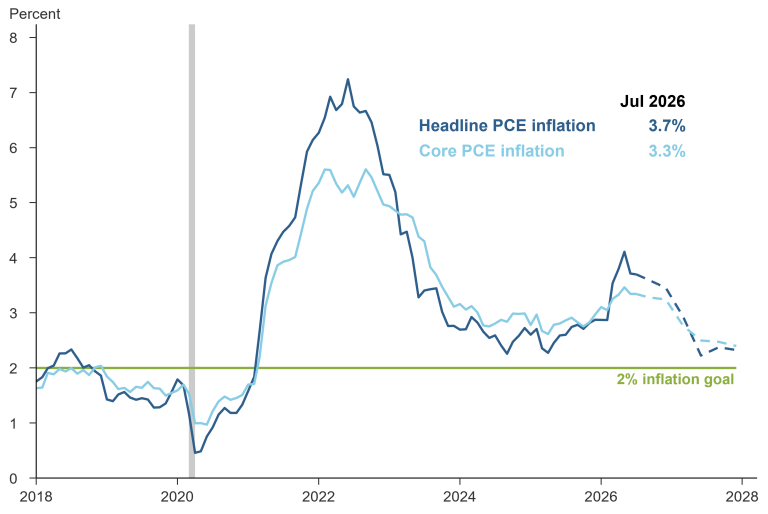
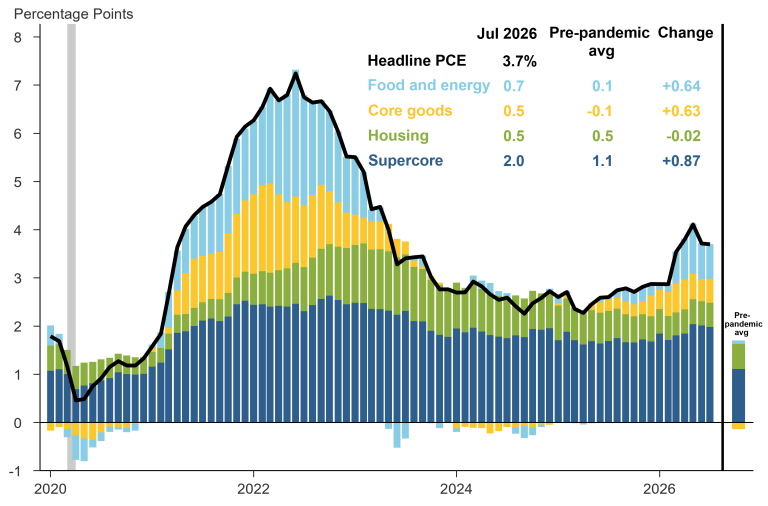
Headline PCE inflation held at 3.7% in July on a 12-month basis, the same as the June reading. Core PCE inflation, which excludes the volatile food and energy categories, also held at 3.3%. Inflation in energy, food, and goods categories has risen since the beginning of the year to become a significant contributor to the pickup in inflation. Combined, these categories account for about 1.2 percentage points of headline inflation in July, compared to an average 0.0 percentage points during the pre-pandemic period of 2016 to 2019.
Inflation moving further above the 2% goal in 2026
12-month headline and core PCE inflation, with forecast
Source: Bureau of Economic Analysis and FRBSF staff.
Supercore inflation, defined as core services inflation excluding housing, remains elevated, contributing 2.0 percentage points to overall inflation versus 1.1 percentage points in the pre-pandemic period. Inflation from housing services declined and is currently close to its pre-pandemic average. Our forecast projects headline and core inflation to have peaked this year and then gradually decline towards the 2% goal. Still, the level of uncertainty around our baseline forecast remains high, and risks to this projection appear tilted to the upside.
Energy and goods contribute to higher inflation
Contributions to 12-month headline PCE inflation
Source: Bureau of Economic Analysis and FRBSF staff calculations.
Labor market stable but potentially vulnerable
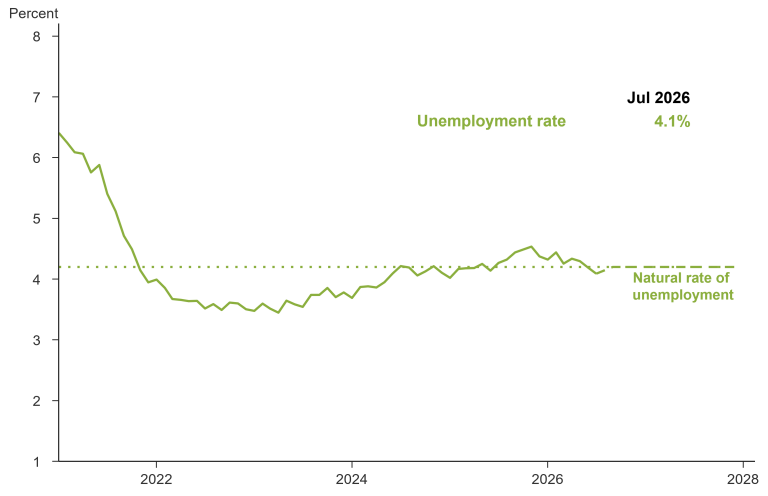
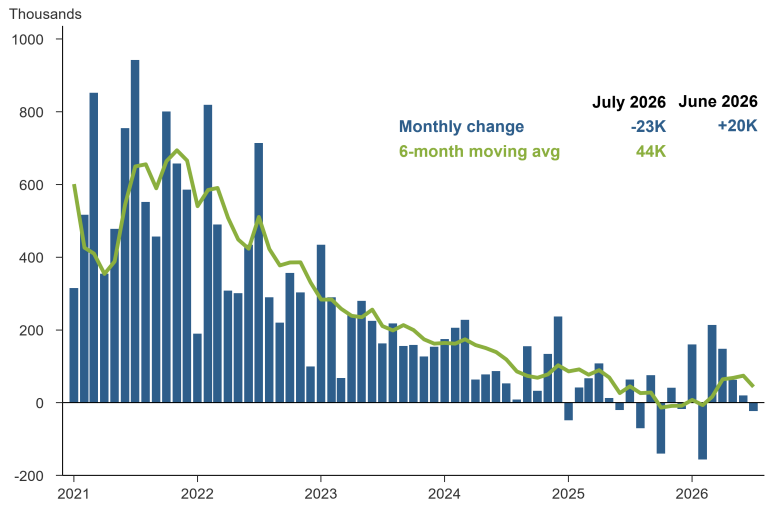
The labor market remains stable but shows signs of potential vulnerability. The unemployment rate stood at 4.1% in July and has moved in a narrow band around this level since late 2024. However, recent monthly job gains have been declining. Total payroll growth averaged 44,300 jobs per month over the six months ending in July, but the economy lost about 23,000 jobs in July and added only 20,000 jobs in June.
Labor market broadly in balance
Unemployment rate
Source: Bureau of Economic Analysis, Bureau of Labor Statistics, and FRBSF staff.
The stability of the unemployment rate amid declining job growth over the past two years indicates that worker demand and supply have slowed in tandem. This is a risk to our forecast in that unemployment could rise if firms’ demand for workers is negatively impacted by rising input costs.
Modest monthly job growth signals vulnerability
Total payroll employment, monthly change
Source: Bureau of Labor Statistics.
Markets expect monetary policy tightening
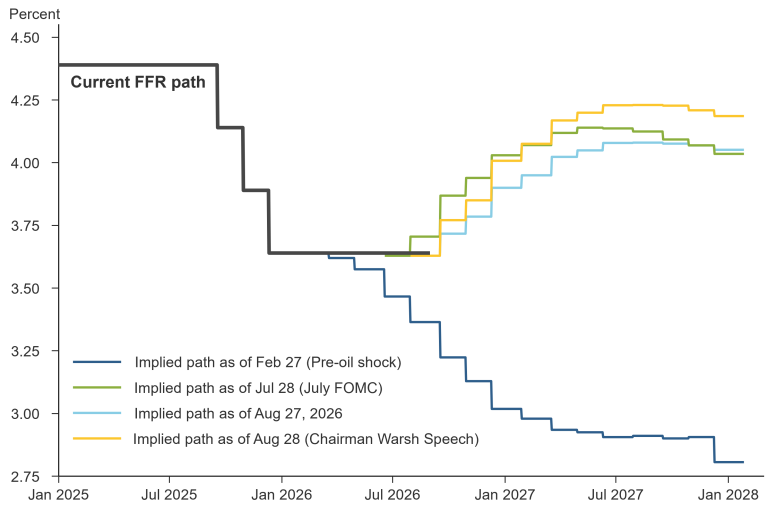
At its July meeting, the FOMC held the target range for the federal funds rate at 3.50% to 3.75%, unchanged since December 2025. During his remarks at the Jackson Hole Economic Policy Symposium on August 28, FOMC Chairman Kevin Warsh reiterated the Committee’s commitment to achieving both sides of the dual mandate. He noted that broad financial conditions were not currently restrictive, that private-sector consumption and investment have remained strong, and that the unemployment rate has remained low and stable. But on the price-stability side of the mandate, inflation has been above the FOMC’s 2% goal for 65 straight months.
Markets expect rate hikes this year and next
Market-implied federal funds rate path
Source: Bloomberg and FRBSF staff calculations.
Market expectations for the policy rate have shifted decisively toward policy tightening in recent months. In early 2026, futures contracts implied a gradual easing of policy over 2026 to 2028. This pattern contrasts sharply with the implied path around the July FOMC meeting, which showed an upward trajectory with the policy rate rising to a range of 4.00% to 4.25% by mid-2027. Fed funds futures prices in August before the Jackson Hole Symposium continued to signal that markets expect policy tightening, though at a more gradual pace compared to the implied path in July. The implied path shifted upwards after the Jackson Hole meeting.
Strong labor productivity growth supports output growth
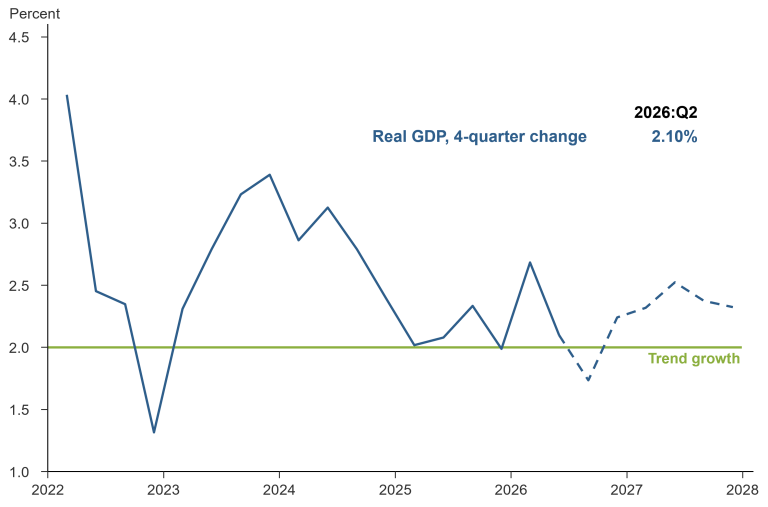
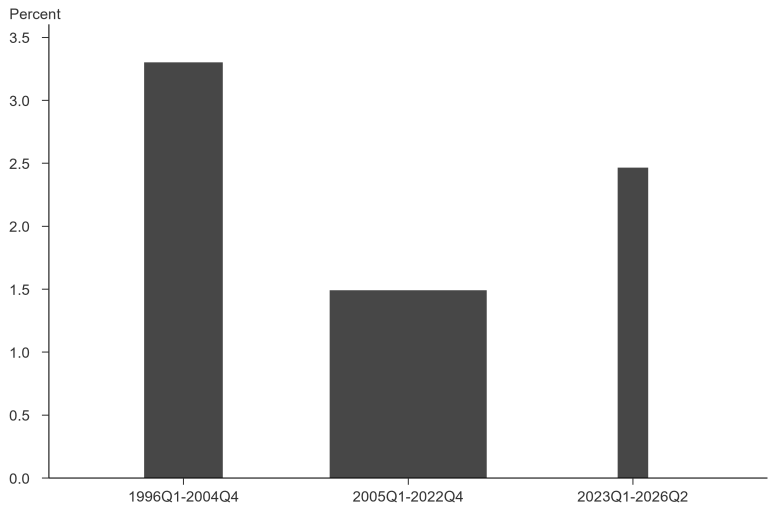
Since 2023, real GDP has grown faster than our longer-run trend growth estimate of 2.0%. The most recent reading of 4-quarter growth in real GDP was 2.1%. Above-trend output growth over the past three years has been supported by robust growth in labor productivity. From the first quarter of 2023 to the second quarter of 2026, output per hour in business sector grew at an average annualized rate of 2.5%. This is significantly faster than the 1.5% rate recorded from 2005 to 2022, but slower than 3.3% rate observed during the strong productivity growth period of 1996 to 2004.
Strong output growth between 2023 and 2026
Real GDP, 4-quarter change
Source: Bureau of Economic Analysis and FRBSF staff.
Labor productivity growth running above pre-pandemic pace
Business sector output per hour, annualized quarterly growth
Investment and factor utilization boost productivity
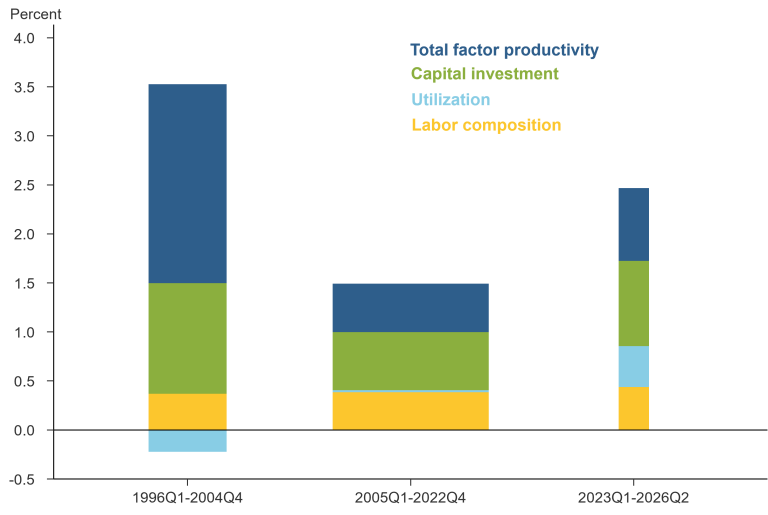
While labor productivity can rise in response to advancements in new technology, it can also be boosted by other factors. These include capital investment that increases the amount of capital per worker, changes in labor composition that affect the skill and experience of workers, and more intense utilization of productive inputs. Two of these factors account for much of the recent strength in labor productivity growth. Since the first quarter of 2023, increases in capital investment and utilization have contributed 1.3 percentage points to labor productivity growth, nearly double the contribution observed over the 2005 to 2022 period.
Investment and utilization boost labor productivity
Decomposition of growth in output per hour
Source: Staff calculation based on Fernald-FRBSF Total Factor Productivity data.
The contribution of better technology to labor productivity growth is commonly referred to as “total factor productivity”. This is the residual component of labor productivity growth after subtracting the other three factors noted above. Total factor productivity growth since 2023 was 0.7%. This is somewhat higher than the 0.5% pace recorded from 2005 to 2022 but much smaller than the 2% pace observed during the strong productivity growth period of 1996 to 2004.
Productivity gains from AI remain uncertain
Economy-wide labor productivity growth can also be decomposed into contributions coming from different industries. Industries experiencing faster AI adoption do not contribute more to overall productivity growth than they did before the pandemic. According to U.S. Census surveys, AI adoption is the highest in professional services, information, finance, and education. Contribution to overall growth from professional services increased more than other industries but contribution from information, finance, and education did not grow faster.
Productivity gains from AI still uncertain
AI adoption versus excess contribution to labor productivity growth
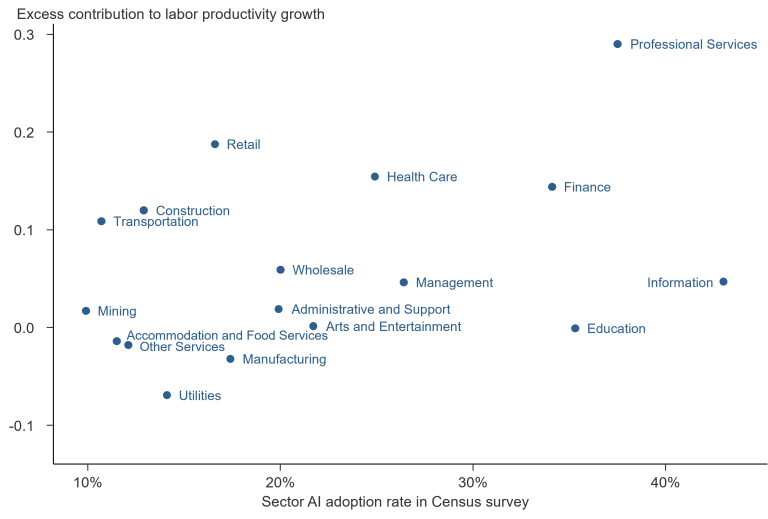
Source: Bureau of Labor Statistics and U.S. Census Bureau Business Trends and Outlook Survey (BTOS).
It remains to be seen whether stronger productivity growth linked to advances in AI technology could help the economy to expand above the 2% trend.
Charts were produced by Leela Khatri.
The views expressed are those of the author with input from the Federal Reserve Bank of San Francisco forecasting staff. They are not intended to represent the views of others within the Bank or the Federal Reserve System. This publication is edited by Kevin J. Lansing, Karen Barnes, and Hamza Abdelrahman. SF FedViews appears eight times a year. Please send editorial comments to Research Library.