
Combining historical economic and meteorological data makes it possible to estimate the economic impacts of El Niño episodes. Such estimates suggest the current El Niño episode may have already caused a small temporary bump in U.S. price levels, which is expected to resolve by the end of the year. Estimates further suggest the episode poses meaningful risk for inflation to increase in 2027, alongside rising employment. These projected effects on inflation and employment add uncertainty to the economic outlook.
El Niño periods occur when trade winds over the Pacific Ocean—which normally blow warm water from the east to the west—weaken. This global phenomenon causes a complex shift in weather patterns, as the eastern Pacific Ocean becomes warmer than usual and the Pacific jet stream shifts south. In the United States, El Niño years typically mean fewer Atlantic hurricanes, more winter precipitation in the southern swath of the lower 48 states, and warmer winters in northern states. Strong El Niño episodes tend to peak in late fall or early winter and are often followed by La Niña years, when Pacific trade winds strengthen and shift the jet stream north.
Weather data indicate that the current El Niño episode is a “very strong” one, which raises concerns about potential economic effects. In this Economic Letter based on analysis in Roth Tran (2026), we estimate how past El Niño episodes since the 1950s have affected the U.S. economy to help gauge potential impacts of the current El Niño. We focus on inflation and employment, which are central to the Federal Reserve’s dual mandate goals of maximum employment and price stability.
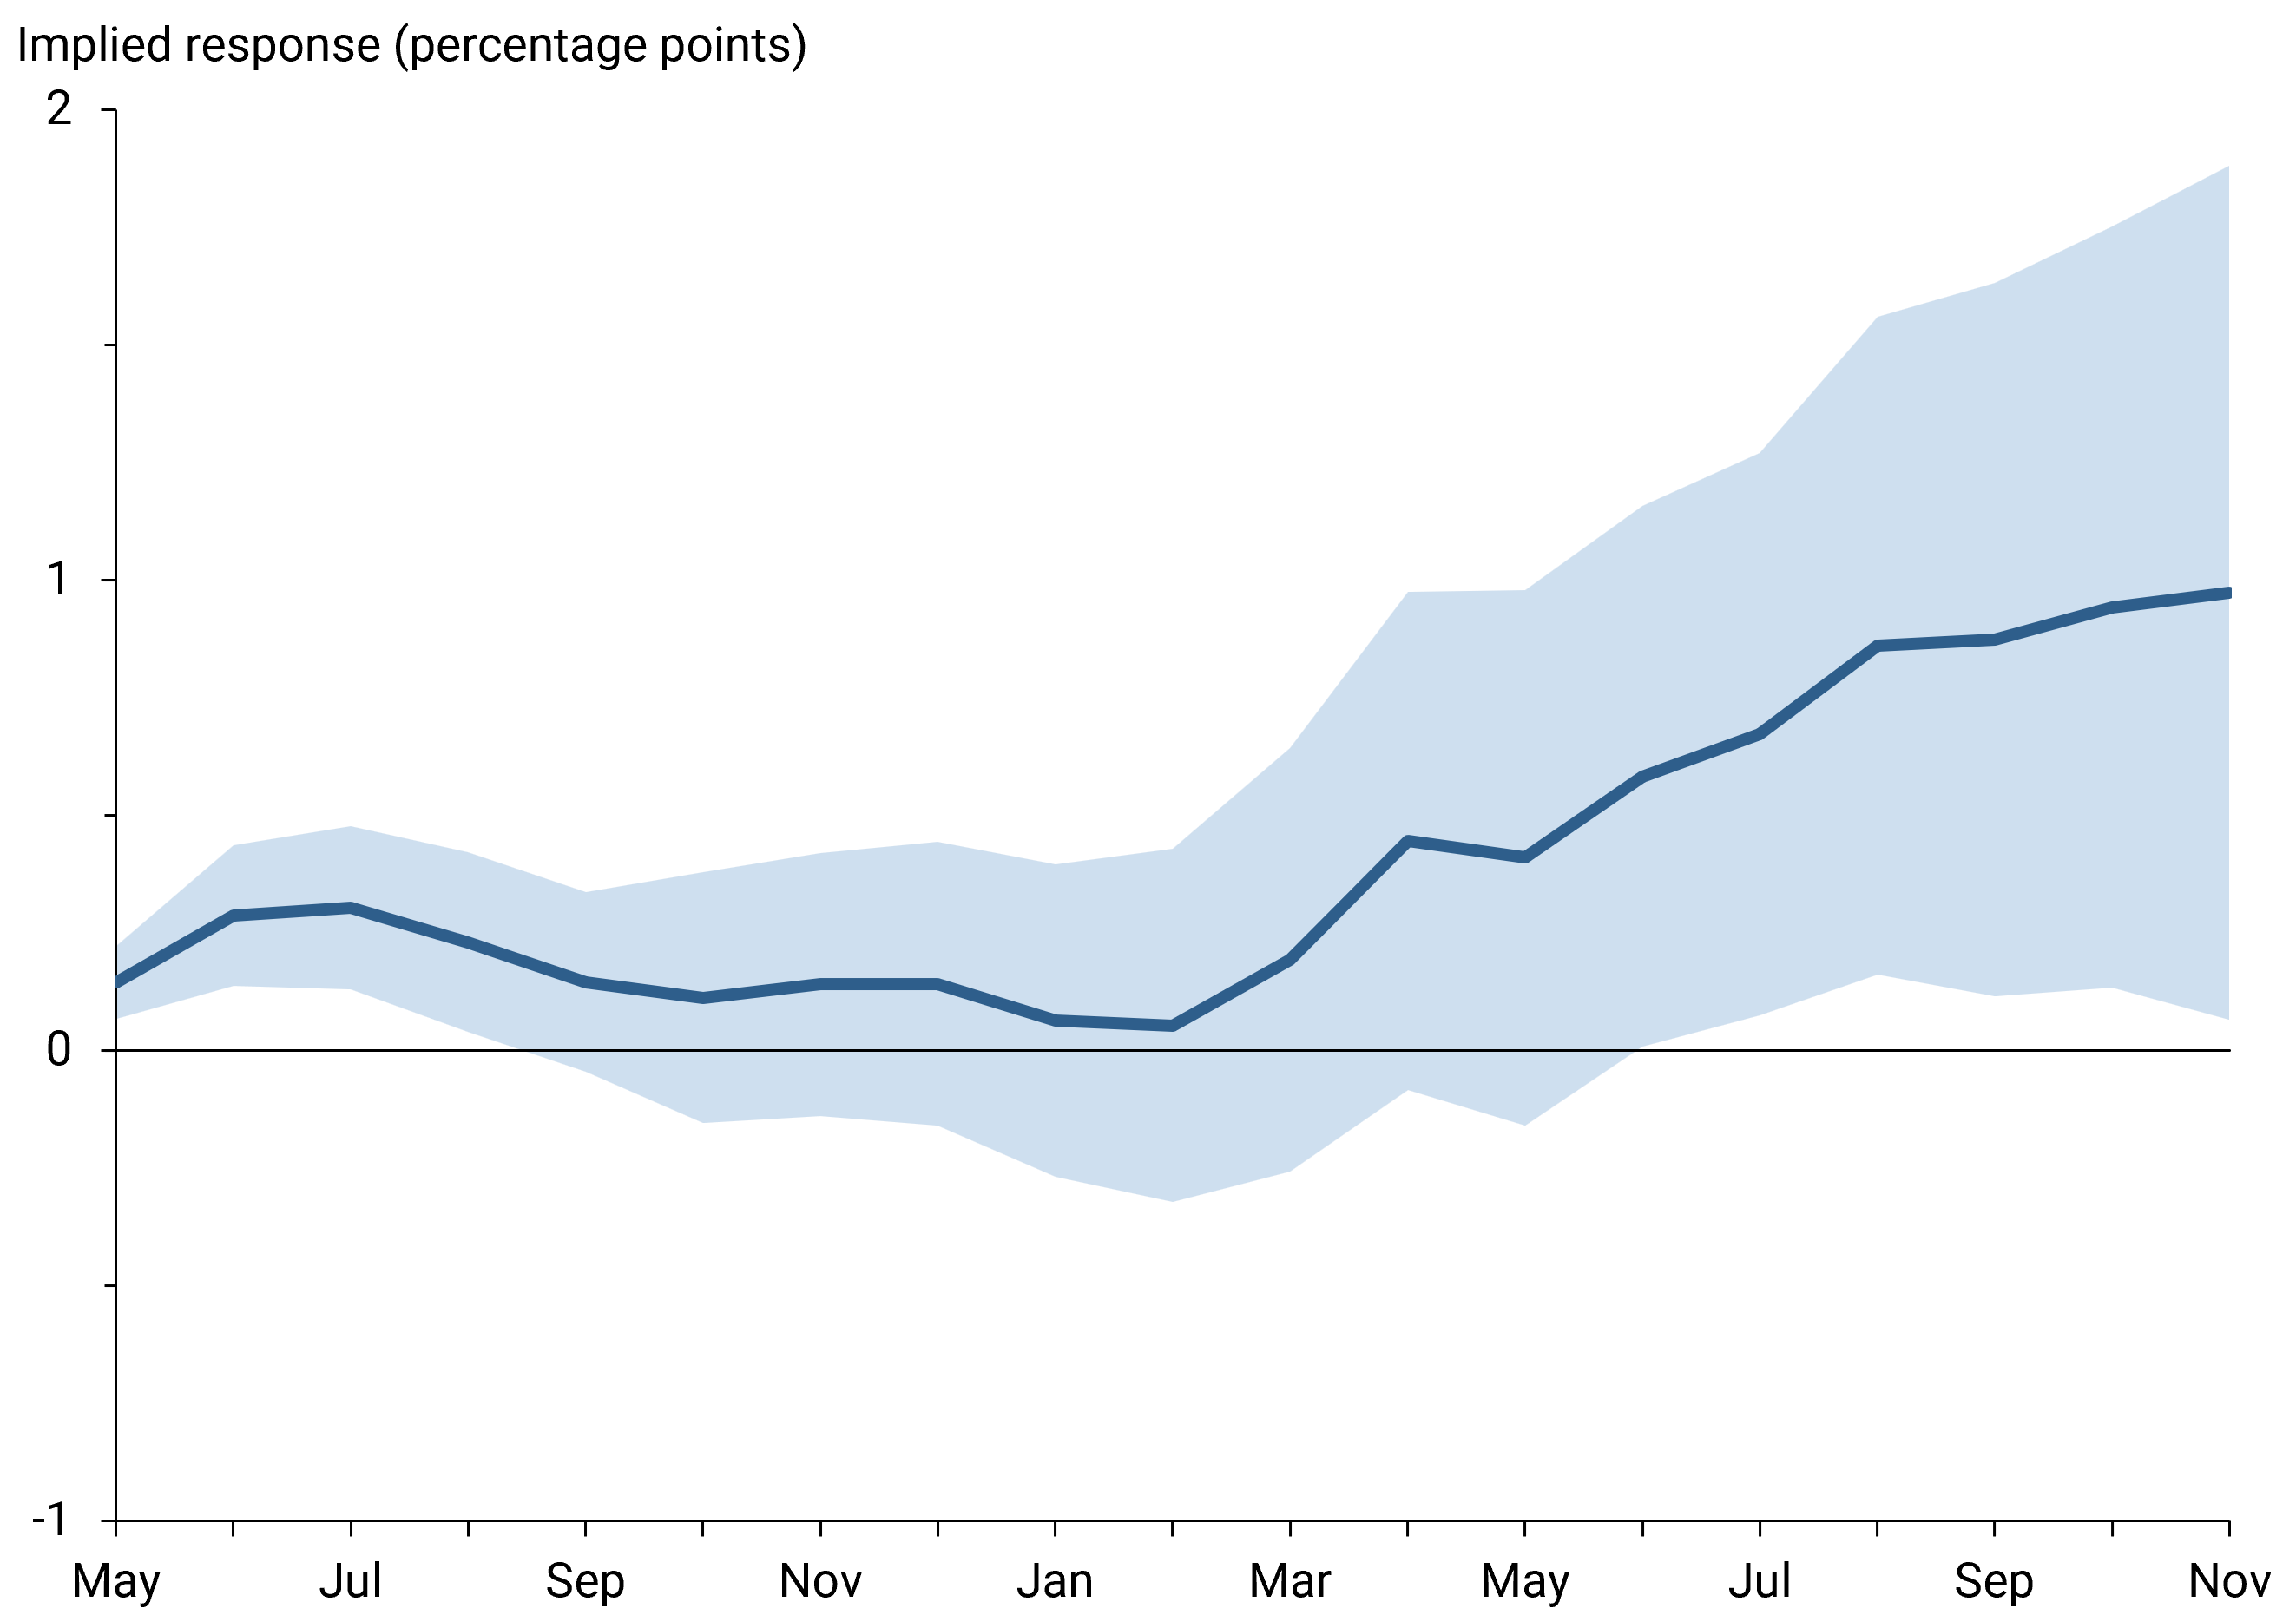
The results of our historical analysis point, in particular, to a risk of higher inflation from the current episode. Our analysis indicates that El Niños drive price levels up temporarily in the first summer of each episode. This boost then tends to reverse by the following January. Applying this method to the current episode suggests that El Niño added about 0.3 percentage point to price levels as measured by personal consumption expenditures (PCE) between April and July 2026. Our analysis points to further price pressures adding a 1 percentage point net increase over the course of 2027 if the current El Niño is followed by a La Niña weather pattern. These increases have historically been driven primarily by core services and food prices. We also find that past El Niño episodes have tended to boost U.S. labor markets, likely due to factors like the warmer winters in the north. The current El Niño may have similar positive effects. However, a lot of uncertainty surrounds the size of these potential economic effects.
Price pressures from El Niño
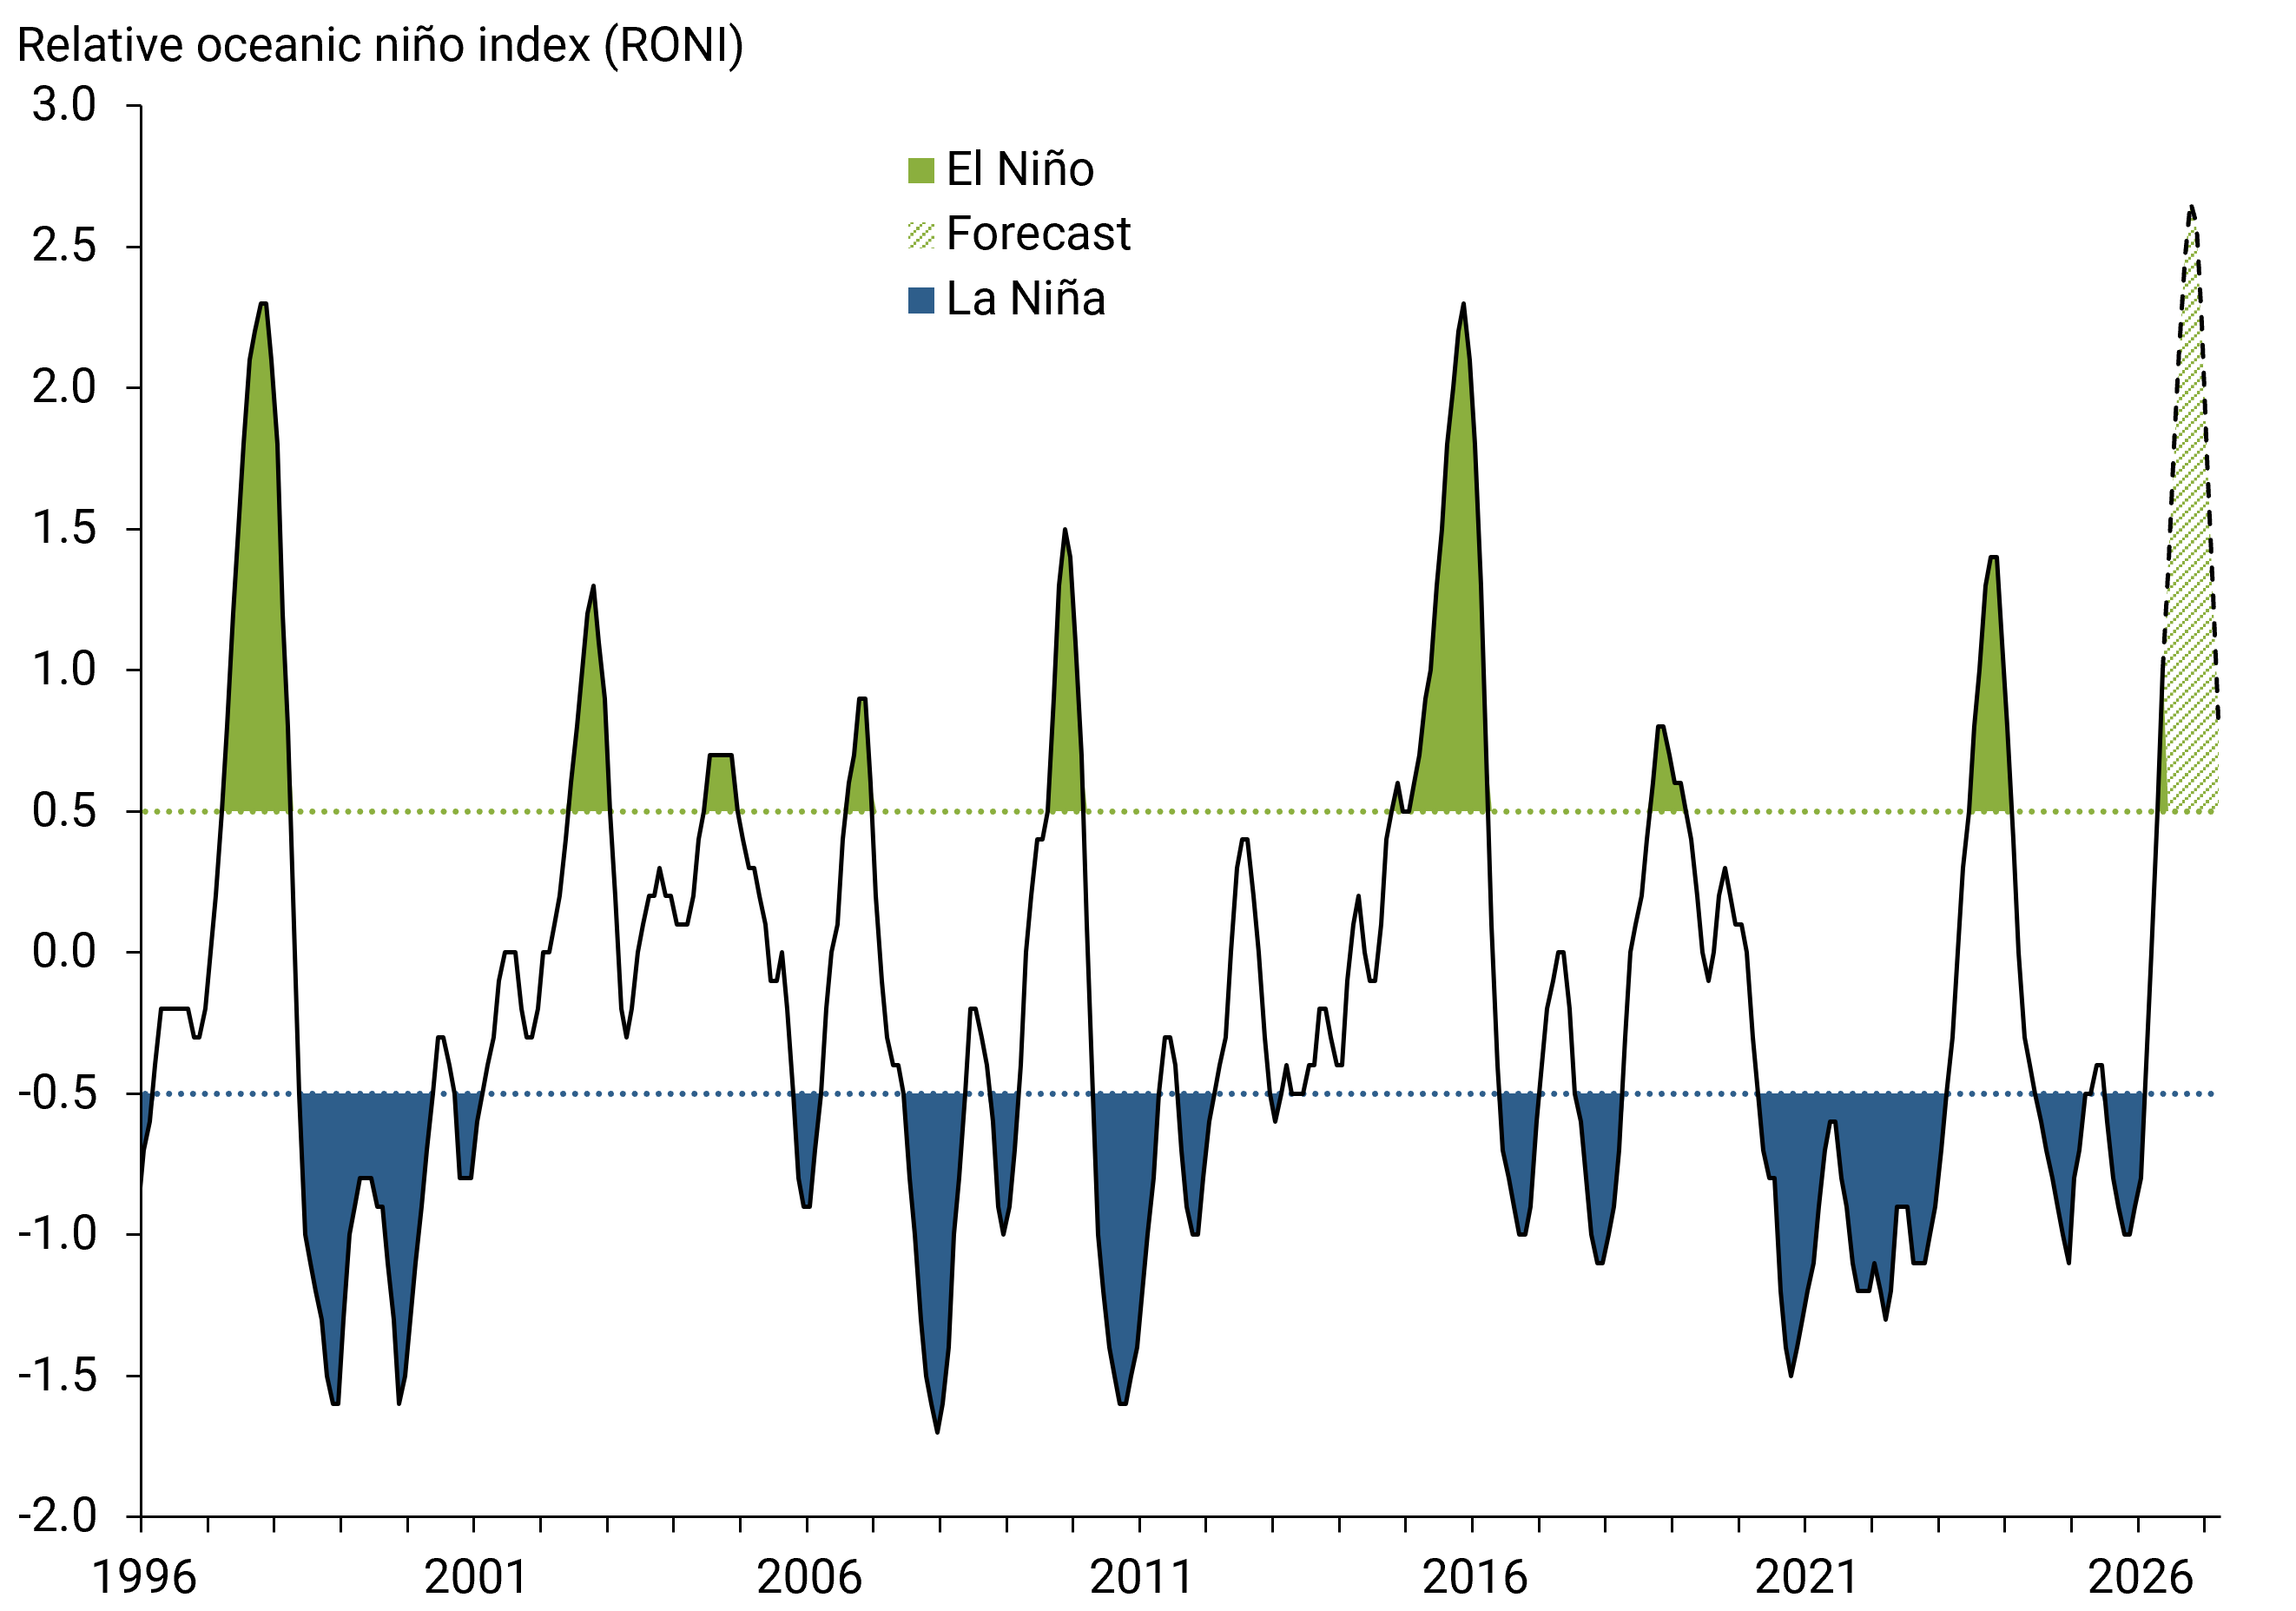
To analyze the impacts of an El Niño on macroeconomic indicators, we use historical data on the Relative Oceanic Niño Index (RONI) provided by the National Oceanographic and Atmospheric Administration. NOAA uses this data series to designate El Niño and La Niña episodes. Figure 1 shows the three-month moving average RONI going back to 1996. The green shaded regions indicate El Niño episodes, when RONI remains at or above 0.5 for at least five consecutive months. The light green region on the right shows the median forecast from NOAA starting in mid-2026.
Figure 1
Current El Niño impacts projected to be unusually large
Weather conditions arising from El Niño can affect a variety of sectors. For example, mild winter temperatures may reduce demand for heating energy and increase productivity in construction and agriculture. Increased precipitation may slow construction activity or increase demand due to flooding (see Downey, Lind, and Shrader 2023 and Roth Tran and Wilson 2025). Moreover, impacts of El Niño-induced weather anomalies on prices and economic activity in other parts of the world can spill over to the United States, affecting prices and economic activity here.
We use regression analysis to estimate the impacts of El Niño episodes on a set of economic outcomes. In particular, we rely on an estimation method called local projections (Jorda 2005) to distinguish between the varying impacts of different El Niño episodes according to their relative strength; we measure this by how large the area in the shaded green region is for each 12-month period that starts in May. We then consider how our outcomes evolve over time starting in May of each year. Our analysis reflects both the direct effects from weather anomalies in the United States and spillovers from anomalies in other parts of the world.
To help gauge what our historical estimates of El Niño effects imply for the current episode, we rescale our estimates by the magnitude of RONI for the current episode, based on recent actual data and forecasts from NOAA. For simplicity, we assume the effects of past El Niños scale up linearly with their meteorological magnitudes.
Figure 2 shows the implied effect of the current El Niño episode on the headline PCE price index (blue line), based on the estimated PCE price effect of past El Niños. The implied effect suggests the current episode may have already raised prices about 0.3 percentage point higher by July than it would have been in the absence of the El Niño. Our analysis indicates that this increase would be expected to reverse by the end of 2026. Additional analysis (not shown here) indicate this temporary price increase comes from core services, energy, and food categories.
Figure 2
Implied response of PCE price index to current El Niño
Source: Authors’ calculations using NOAA and Bureau of Economic Analysis data.
Figure 2 also shows that El Niño poses significant inflation risk for 2027. Our model finds that El Niños have historically been followed by significant inflation the next year. The estimates imply a 1 percentage point increase in PCE prices over the course of 2027 related to this El Niño episode. Additional analysis (not shown here) suggests, similar to the temporary effects, that the overall price effects are driven largely by upward price pressures for core services and food.
We note that there is a lot of uncertainty inherent in these findings. In particular, by examining the impact of El Niño while separately accounting for the RONI for the following year, we find that our statistical model expects a La Niña in 2027. This is not surprising, given that strong El Niño episodes are often followed by La Niña episodes (see Figure 1). In the absence of a La Niña in 2027, the model expects no further net price effects in 2027. However, whether a La Niña episode will materialize in 2027 remains uncertain. Indeed, some El Niño episodes last longer than a year, and our model is not constructed to forecast RONI. Thus, we characterize our findings as pointing to meaningful risk for inflation in 2027 stemming from this El Niño episode.
El Niño’s effects on employment
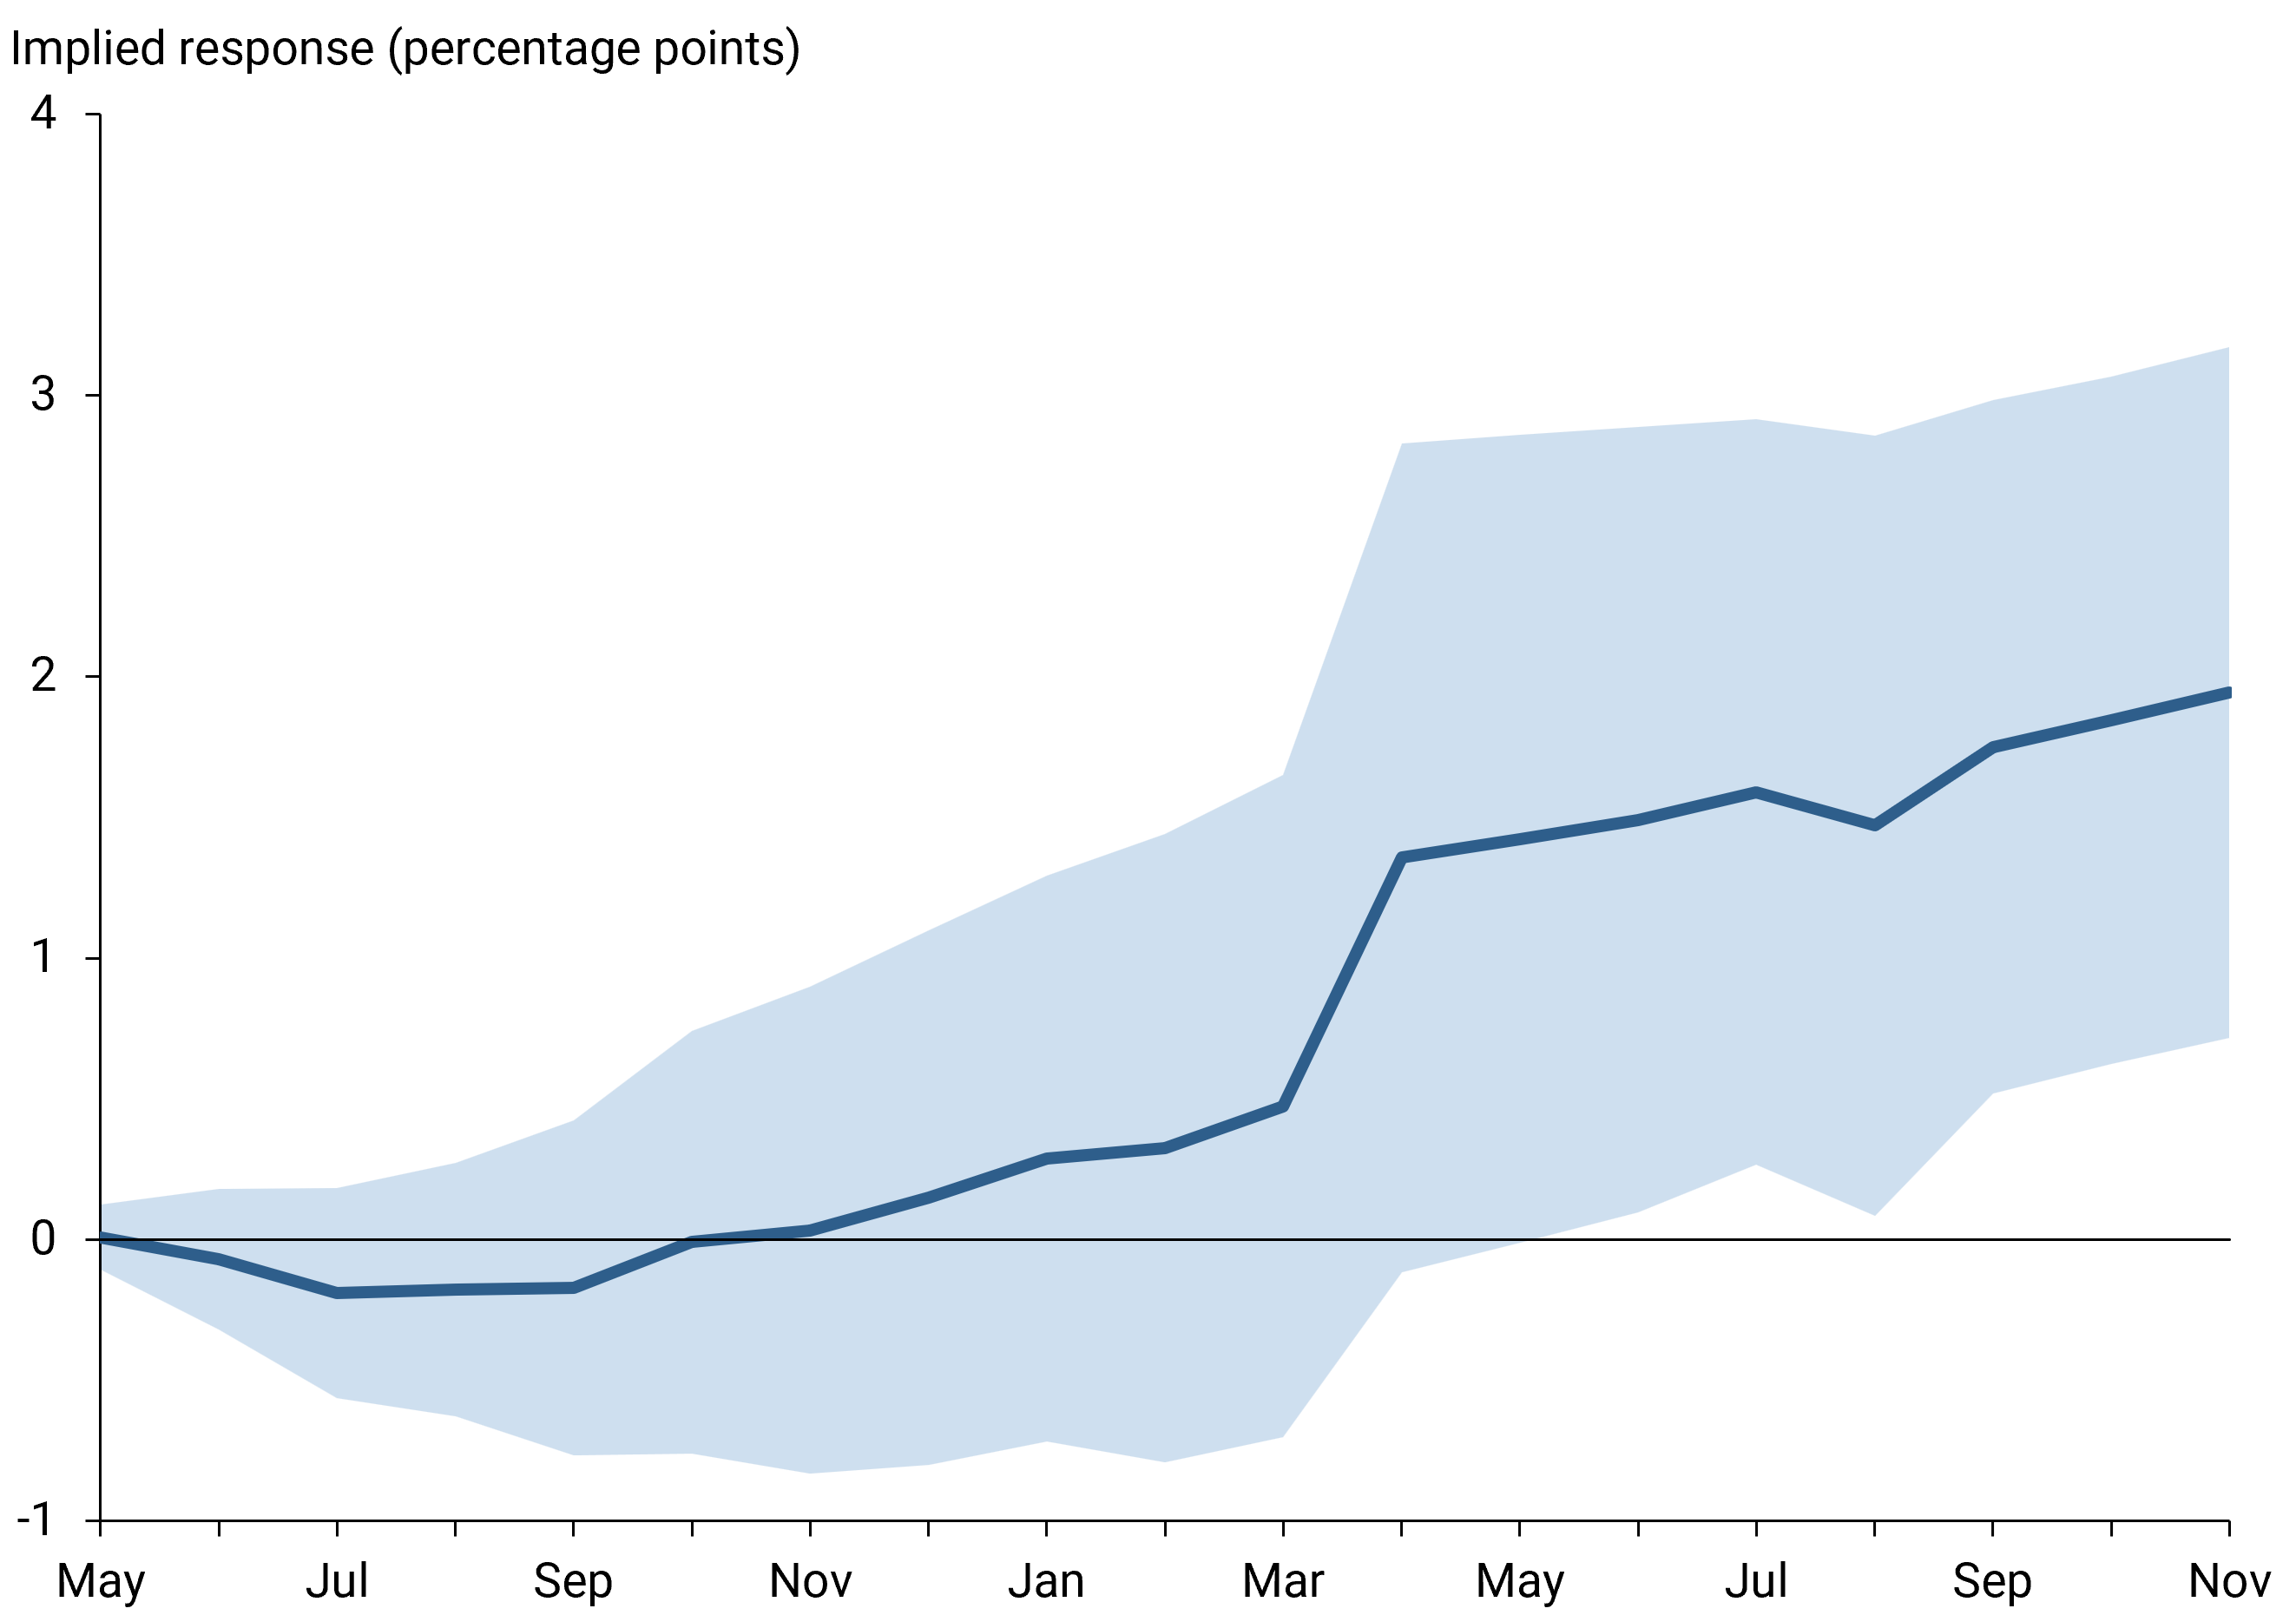
Figure 3 shows our results regarding the impact of El Niño on total nonfarm payroll employment. Historical data show that total employment generally has been unaffected by El Niño in the first year but then rises in the following year.
Figure 3
Implied employment response to El Niño
Source: Author calculations using NOAA and Burea of Labor Statistics data.
Unlike the estimated inflationary impact, we find that this increase in employment tends to occur regardless of whether there is a La Niña in the following year. Unemployment (not shown) displays a similar pattern, remaining flat in the first year before improving in the subsequent year. These results point to potential higher employment stemming from El Niño in 2027.
Sources of uncertainty
The wide variation in El Niño episodes and inherent uncertainty around weather forecasting underlie several important caveats to these findings. First, although our analysis uses data going back to the 1950s, the sample includes only 22 El Niño events, of which only four were very strong. Thus we have only a limited number of observations from which to extrapolate. Second, the current El Niño is projected to be stronger than any of the historical events in the data we use. As mentioned earlier, we infer current episode effects based on a simplifying assumption that they increase linearly with the magnitude of our El Niño measure. However, this assumption may not apply to the current El Niño episode. Consider the example of precipitation. While a moderate increase in precipitation in the southern parts of the United States may be beneficial, too much of it can cause flooding. The potential for the current El Niño episode to cause particularly severe outcomes like large-scale or widespread disasters that are not captured in this analysis adds a layer of uncertainty not directly reflected in our estimates. Third, there is uncertainty in the forecast for both the current El Niño episode used to scale the effects and the potential for a La Niña in the coming year.
As with most analysis of current economic events, the economic environment may be different in important ways from that of past El Niños. For instance, weather forecast quality and lead time have improved dramatically since the 1950s, allowing businesses, households, and policymakers to better prepare for and mitigate negative effects. At the same time, in our modern, globally integrated markets, our economy may be more sensitive to foreign shocks. More recent developments like the disruptions to the fertilizer market, supply chain disruptions in energy markets, and record-setting weather events could also interact with this El Niño in unexpected ways.
As a result of these types of caveats, we emphasize that El Niño adds a layer of uncertainty to the economic forecast, particularly in terms of the potential for higher inflation in 2027.
Conclusion
A strong El Niño can have complex and varied effects on the U.S. economy by shifting weather patterns in the United States and around the globe. In this Letter, we estimate these effects to infer the potential impact of the current El Niño. We estimate that the current episode may have already increased headline price levels about 0.3 percentage point between April and July of this year. The estimates point to that initial rise fading by the end of this year but then potentially pushing prices up in 2027 by as much as 1 percentage point.
Because the latter result is particularly uncertain, we consider these results not as a forecast but rather as pointing to a meaningful risk of higher inflation next year from this El Niño cycle. In terms of the real economy, the results also imply the potential for higher employment starting in 2027. We caution that there are several caveats for our results, including that available data include a limited number of very strong El Niño events, that the current economic environment is different from historical events, and that El Niño forecasts are themselves inherently uncertain.
References
Downey, Mitch, Nelson Lind, and Jeffrey G. Shrader. 2023. “Adjusting to Rain Before It Falls.” Management Science 69(12), pp. 7,399–7,422.
Jordà, Òscar. 2005. “Estimation and Inference of Impulse Responses by Local Projections.” American Economic Review 95(1), pp. 161–182.
Roth Tran, Brigitte. 2026. “In Hot Water? The Macroeconomic Impacts of El Niño.” FRB San Francisco Working Paper 2026-21.
Roth Tran, Brigitte, and Daniel J. Wilson. 2025. “The Local Economic Impact of Natural Disasters.” Journal of the Association of Environmental and Resource Economists 12(6), pp. 1,667–1,704.
Data
Download data for figures (Excel, 233 kb)
Pacific Basin Notes are published occasionally by the Center for Pacific Basin Studies. Opinions expressed in FRBSF Economic Letter do not necessarily reflect the views of the management of the Federal Reserve Bank of San Francisco or of the Board of Governors of the Federal Reserve System. This publication is edited by Anita Todd with the assistance of Karen Barnes. Permission to reprint must be obtained in writing.