Download PDF (pdf, 351 kb)
The Federal Reserve conducted a follow-up Diary of Consumer Payment Choice in 2015. Read the FedNotes paper, “Cash Holdings: A New View on Cash,” to see how current findings compare to the 2012 data.
Is the reign of cash as king of the payments system coming to an end? While more than half of consumers continue to view cash as the safest and most secure payment method,1 opportunities are popping up where it is no longer a payment option. Airlines do not accept cash for in-flight purchases, on-demand services such as Uber require a credit or debit card for payment, and even new cashless eateries such as New York’s Commerce2 and San Francisco’s Eatsa3 are gaining popularity.
In an evolving payments landscape where cash is no longer a necessity and sometimes not even an option, one may wonder why people still choose to carry cash in their wallets. This viewpoint is not uncommon, with Bankrate.com reporting that one in 10 Americans today no longer carries cash.4 With new financial products such as Venmo and Apple Pay, some consumers may no longer see a need to always carry cash. Yet, currency in circulation continues to grow, with even low value denominations5 growing 2.5 percent in volume year to date.
This paper explores those segments of the population that resist cash’s alleged decline and continue to carry cash. It finds that people who hold cash differ from the general population—they have a larger preference for credit cards, tend to be older, and tend to be more affluent. Beyond this, different subgroups of people who hold cash exist, with some using cash exclusively as a payment instrument and others holding onto cash solely for emergency uses.
Data
This paper uses a dataset called the Diary of Consumer Payment Choice (DCPC) collected by the Boston, Richmond, and San Francisco Federal Reserve Banks. The DCPC asked participants to record all financial transactions for an assigned three-day period.6 In addition to gathering information on transactions and demographics, the DCPC also asked participants about their primary and backup payment method preferences.
What We Know about Cash
As a payment method, cash continues to be both praised and criticized. The Bank of Canada cites many motivations to use cash, such as its wide merchant acceptance, low handling costs, disciplinary budget control, and purchase anonymity.7 Cash is a highly convenient payment method and, as the Richmond Federal Reserve found, it is often one of the few options available for unbanked and underbanked individuals.8
Despite these benefits, cash also has its downsides. Because of cash’s anonymous nature, cash transactions may be difficult to trace or remember for record-keeping and budgeting purposes. Furthermore, cash users must continuously acquire more cash to replenish what has been spent. These acquisitions, whether in the form of ATM withdrawals or transfers from another person, are costly9 in terms of time, labor, and possible transaction fees.
While research has been done on consumer cash usage10 and cash holdings of specific denominations,11 this paper focuses on the group of people who hold cash and the different subgroups that exist within it.
Cash Holders and How They’re Different
Working from the data available in the Diary of Consumer Payment Choice, we define someone who holds cash as anyone with more than $1 in their pocket, purse, or wallet. Diary participants were given one of three holding labels based on how frequently they carried cash: (1) People who had zero cash on them for all three observed Diary days were labeled as “never” holding cash, (2) people who had cash on some days and zero cash on others were labeled as “sometimes” holding cash, and (3) people who had cash on them on all three days were labeled as “always” holding cash.
In an ever-changing payments landscape, the question of who these people are that continue to carry cash plays an important role in helping us better understand the future of cash.
Consumers that hold cash aren’t necessarily those who prefer cash
At first glance, we would expect people who hold cash to be the same people who prefer to use cash. However, the group of people who hold cash is much larger. While only 30 percent of the general population prefers cash as their primary payment instrument, 64 percent “always” carried cash on all three days of the diary.12 Figure 1 depicts the relationship between the general population (grey), people that always held cash (red), and people who prefer cash (blue).
There is only a small overlap between the group of people who prefer cash and the people who always hold cash – 18.8 percent of the general population fall into both groups. The lack of overlap between the two circles indicates that people must hold cash for reasons other than simply liking it as a payment instrument.
Since a person may still hold cash even if he prefers debit or credit card, we examine which payment instrument preference yields the largest share of people who sometimes or always holds cash. Figure 2 shows surprisingly that the group with the largest share of cash holders (94 percent) is actually people who prefer credit cards. Overall, debit cards are the most popular payment instrument, yet only 86 percent of debit card preferrers held cash on at least one of the three days of the Diary study. Of the people who prefer cash, 91 percent held cash at some point.
It is interesting that people who prefer using credit cards had the largest share of cash holders, and that 9 percent of people who prefer cash never held cash during the Diary. These statistics emphasize the diversity of the cash holder group.
Consumers that hold cash are relatively more affluent and older
Reversing the view, we look at the payment instrument preferences of people who always hold cash compared with the payment instrument preferences of the general population in Figure 3. The preferences are similar, with people who always hold cash having a slightly larger preference for credit. Nonetheless, like the general population, the plurality of cash holders still prefer debit as their primary payment instrument.
In general, cash holders are on the older end of the age spectrum. Figure 4 compares the age breakdown of the general population with the age breakdown of people who always hold cash. People who hold cash are more heavily concentrated in the 45 and older age groups, with a much smaller share of people who are under age 34. The share of 18-24 year olds who hold cash is half the size of the share of 18-24 year olds in the general population.
Given that people who hold cash tend to be older, it may make sense that they also tend to have higher household incomes, seen in Figure 5.
While the household incomes of the general population and of people who prefer cash fall more towards the lower end of the income spectrum, a good portion of cash holders’ household incomes falls on the higher end. The general population’s average household income is on the upper limit of the $25,000 – $49,999 range. People who always hold cash have an average household income on the lower end of the next income range, $50,000 – $74,999. One quarter of people who always hold cash have household incomes greater than $100,000, while only 19 percent of the general population and 10 percent of cash preferrers fall in that same range.
Now we know that people who hold cash have a higher preference for credit, tend to be older, and tend have higher household incomes. However, these findings do not fit with what previous Diary research13 has shown about people who prefer cash. People who hold cash tend to have higher household incomes, yet preference for cash declines sharply as household income exceeds $25,000. People who hold cash also tend to prefer debit, not cash, as a primary payment instrument. These dissonances emphasize that people who hold cash are not the same as people who prefer cash. To better understand this difference, we look at the different types of cash holders that exist.
Cash Holders and their Cash Spending Habits
To differentiate among the various types of cash holders, we look at two primary factors: (1) how often individuals hold cash and (2) how often they make cash transactions (“spend cash”).
As discussed above, Diary participants were classified as “never,” “sometimes,” or “always” holding cash. Similarly, participants were also given one of three labels for how frequently they spent cash – (1) “never” spenders made zero cash transactions on all three Diary days, (2) “sometimes” cash spenders made a cash transaction on at least one Diary day, and (3) “always” cash spenders made at least one cash transaction all three Diary days.
The Figure 6 matrix shows how the general population falls into each cross-section of cash holding and spending:
Figure 6: Types of Cash Holders based on Cash Spending Frequency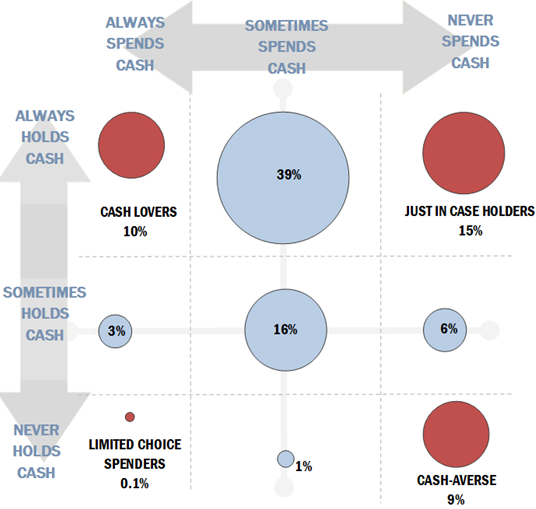
The largest subset of the population, at 39 percent, falls into the “always holds cash” but only “sometimes spends cash” quadrant, in the middle of the top row. While the bulk of the population is here, the extreme users highlighted in red in the outer corners exhibit more interesting characteristics. They are listed as follows, starting at the top left going clockwise:
- “Cash Lovers” (top left)
This group always holds and always spends cash. - “Just-in-Case Holders” (top right)
This group always holds cash but never uses it. It views cash as a safety net or a contingency fund. - “Cash-Averse” (bottom right)
This group neither holds nor uses cash as a payment instrument. - “Limited Choice Spenders” (bottom left)
This group does not hold cash but consistently uses it to make purchases.
We will explore the make-up of these four distinct categories of cash holders in more depth in the next section. Underlying details about each group can be found in the Appendix (pdf, 45 kb).
The Four Types of Cash Holders
Type 1: Cash Lovers hold the most cash
“Cash Lovers” are heavy cash users. They’re the people who seem to always have cash on them and who like to pay for everything with cash. One out of every 10 people in the general population falls into this category, and people in this group make an average of seven cash transactions a day. This group also carries the most cash of any other subgroup, holding an average of $85 per person each day.
Figure 7 shows that a larger share of cash lovers falls in the older age groups. Just under half of this group (43 percent) is between the ages of 35 and 54, a segment that is closer to a third (36 percent) when looking at the general population. Millennials (ages 18 to 34) make up less than one-fifth of the cash lover group, and only 5 percent of cash lovers are under 25 years old. These millennial numbers are disproportionately smaller than the nearly one-third share (31 percent) millennials hold in the general population.
Unsurprisingly, cash is the preferred payment instrument for cash lovers. Figure 8 shows that 47 percent of cash lovers prefer cash, followed by 36 percent preferring debit cards. Only 16 percent of cash lovers chose credit as their preferred payment instrument. Cash and debit dominate this group’s preferences, with the two instruments accounting for 83 percent of the group’s preferred payment methods.
One explanation for these two instruments’ popularity might be their ability to be used for budgeting purposes. Cash lovers might use cash to have better control of their finances, and both cash and debit allow for budgetary discipline. The amount of cash remaining in a wallet or the balance remaining in a checking account serves as a reminder of how much money is still available to use.
The cash lover group’s incomes closely follow those of the general population, seen in Figure 9. Cash lovers tend to be slightly more concentrated in the middle income ranges, with fewer households in the extremes than the general population. The group’s median income is in the high $25,000-$49,999 range.
Overall, cash lovers tend to follow the norm of the general population, with about the same household income. They differ slightly in that they are older in age and have a higher preference for cash as a payment instrument.
Type 2: Just-in-Case Holders view cash as contingency tool
The second group, “just-in-case” cash holders, consists of people who never spend cash yet always hold cash. If reading that description summoned an image of an older person saving a stack of cash in their wallet for emergency use only, you are not too far off. This group makes up 15 percent of the general population and is heavily concentrated in the higher end of the age range, seen in Figure 10. This group has the oldest average age of 52 years old, and almost half of the group is older than 55.
As shown in Figure 11, just-in-case holders have a much larger preference for credit cards and a smaller preference for cash. The smaller preference for cash makes sense given that this group never spends cash. The larger preference for credit is likely related to the group’s household income, and we would expect the just-in-case holders group to be more affluent; after all, a person must have some wealth if he is able to hold cash “just in case” as an emergency fund rather than use it to pay bills.
Figure 12 looks at the household incomes of just-in-case holders compared with those of the general population and cash lovers. As expected, just-in-case holders have higher household incomes than the general population. Though the group’s average household income is in the same range as the cash lovers group’s ($50,000-$74,999), it is slightly higher in the range.
Another note to point out about this group is that 100 percent of this group always holds cash ($73 per day on average) despite only 16 percent of the group having a preference for it as a payment instrument. This contrast points to a unique view of cash: for just-in-case holders, cash is a contingency plan and something to have just in case you need it, not a day-to day payment instrument.
Type 3: Cash-Averse are likely to be young
The “cash-averse” group never holds cash and never spends cash. These are the people with ridiculously sleek wallets that have no compartments for cash or coin; they are the people frantically looking for a nearby ATM when they accidentally stumble into a cash-only restaurant; and they are the people that are often written about in articles hyping cash’s decline.
The cash-averse group makes up 9 percent of the general population, almost just as large a share of the general population as their polar opposite, the cash lovers. However, this group’s demographics are very different.
Figure 13 shows that unlike previously discussed groups, members of this group are young. The bulk lies in the millennial age range. Though the average age of this group is 35 years old, an overwhelming majority (62 percent) is younger than 35.
Given the group’s aversion to cash transactions, we would expect their preferences to be strongly for non-cash instruments, such as debit and credit card. This expectation makes Figure 14‘s breakdown of the cash-averse group’s payment preferences puzzling. If this group is cash-averse, we would expect this cash holder subgroup to have the largest share preferring non-cash payment instruments. However, a smaller share of this group prefers credit and debit cards (71 percent) than the just-in-case holders group (77 percent). Furthermore, given that this group never holds and never spends cash, it is especially perplexing that almost a quarter of them (23 percent) list cash as their preferred payment instrument.
The relatively younger ages of this cash-averse group may explain the group’s unexpected payment preferences. The 19 percent of the group that falls between 18 and 24 years old likely has limited access to credit cards, either due to lack of financial maturity or assets. As a result, they would logically depend on debit and cash as their main payment instruments, which is what we see with the 57 percent debit preference and 23 percent cash preference. Credit is the least popular payment instrument of the three. The group’s income distribution in Figure 15 further lends support to this theory.
The cash-averse group’s income distribution is strongly skewed, with a considerably small share in the upper-income end. Nearly four in 10 cash-averse individuals (39 percent) earn less than $25,000 annually, and almost two thirds of this group earns less than $50,000. Members of this group are most likely in the process of building their credit and subsequently depend on cash and debit (the two most popular payment instruments in this subgroup) to make payments.
Type 4: Limited Choice spenders are the smallest and youngest group
Due to the small sample size of this group in our data, we were not able to draw conclusions about the limited choice spenders group. The data we did have showed this group of cash holders to be both the smallest (0.1 percent of the population) and the youngest (average age of 30 years old). The median household income for this group is in the $25,000 to $49,999 range.
Though at first it may seem impossible to always spend cash yet never hold it, we believe individuals in this category are limited in wealth and primarily use cash to pay. This group likely does not hold cash because they cannot afford to; they need to spend what cash they do have to pay bills. Qualitatively, examples of individuals in this category may include spend-heavy consumers with cash allowances or part-time jobs as their sole source of income as well as low-income or unbanked individuals who do not have access to credit or debit cards.
What do these findings mean for the future of cash?
Cash critics usually depict cash as a burdensome payment method that is quickly becoming a thing of the past. However, our findings show that 89 percent of the population continues to hold cash to some extent (either sometimes or always), and the number of notes held by the public continues to grow, making all the hubbub about cash’s extinction appear unfounded.
One legitimate cause of concern though is the large amount of young people who do not regularly hold or use cash. A study done by the Independent Community Bankers of America found that one in four millennials holds less than $5 in cash seven days a week.14 The Huffington Post predicts that the practice of carrying cash will die with the millennial generation.15 Business Insider’s Intelligence study found that 40 percent of millennials would stop using cash if a credit or debit card could replace all cash transactions.16 This paper’s findings confirm this cash-averse behavior among the young; more than 60 percent of the “cash-averse” group falls in the 18-34 year old category.
It is possible that this behavior is simply a life-stage effect, and as these 18-34 year olds grow older, their preferences and behavior will shift to mirror those of older age groups. On the other hand, it is also possible that there has been a permanent generational shift in preferences—young people may truly view cash as unnecessary or burdensome and may prefer using new technologies to make payments. The Diary results also reveal that this younger age group is more comfortable using a debit or credit card for a transaction under $10 than their older peers. If there has indeed been a permanent generational shift in preferences, cash usage may be at the beginning a long-term, if likely slow, decline.
Other important considerations when forecasting cash’s future are the roles that income and credit or debit card access play in how much cash an individual holds or uses. New developments in payment instruments for low-income and unbanked individuals may adversely influence cash holdings and cash usage, particularly among the cash-averse and limited choice holder categories. Given that 10 percent of the population falls into our matrix’s “never holds cash” category, new developments in financial accessibility could pull greater numbers of people away from cash.
With the 2015 Diary of Consumer Payment Choice under way, the CPO is eager to see if the demographic make-up of the four cash holder categories changes and if the pattern among the young is indeed a preference shift or a life stage effect. Further monitoring of alternative payment method preferences will also shed light on the risks to cash. Currently, the future of cash and cash holdings remains uncertain.
Download the Appendix (pdf, 45 kb)
The views in this paper are solely the responsibility of the authors and should not be interpreted as reflecting the views of the Federal Reserve Bank of San Francisco or the Board of Governors of the Federal Reserve System.
About the Cash Product Office
As the nation’s central bank, the Federal Reserve ensures that cash is available when and where it is needed, including in times of crisis and business disruption, by providing FedCash® Services to depository institutions and, through them, to the general public. In fulfilling this role, the Fed’s primary responsibility is to maintain public confidence in the integrity and availability of U.S. currency.
The Federal Reserve System’s Cash Product Office (CPO) provides strategic leadership for this key function by formulating and implementing service level policies, operational guidance, and technology strategies for U.S. currency and coin services provided by Federal Reserve Banks nationally and internationally. In addition to guiding policies and procedures, the CPO establishes budget guidance for FedCash®17 Services, provides support for Federal Reserve currency and coin inventory management, and supports business continuity planning at the supply chain level. It also conducts market research and works directly with financial institutions and retailers to analyze trends in cash usage.
About the Diary of Consumer Payment Choice (DCPC)
The 2012 DCPC was a joint project by the Federal Reserve Bank of Boston’s Consumer Payments Research Center (CPRC), the Federal Reserve’s Cash Product Office in San Francisco (CPO), and the Federal Reserve Bank of Richmond’s Payments Studies Group (PSG). It is used as a benchmark for the CPRC’s Survey of Consumer Payment Choice as well as a tool for strategic planning and economic analysis.
The Diary surveyed a random sample of 2,468 respondents across the United States, based on the American Life Panel administered by the Rand Corporation. Responses were weighted to match the Census Bureau’s Current Population Survey population estimates. Participants were asked to record their transactions in the month October to minimize seasonality effects18 in consumer spending patterns. Their responses were also staggered over the month of October 2012 to ensure there were almost equal numbers of participants each day.
Diary participants recorded their transactions for three consecutive days, including purchases, bill payments, cash withdrawals, and deposits. They were asked how much cash they had in their wallets at the start and end of each day. Paper journal memory aids were given to help respondents log their transactions and identify details of each payment. Participants then recorded the payment activity on a website at the end of each day.
Along with payment activity, payment preferences were also recorded at the beginning of the Diary. These records allow insight into the relationship between the consumer’s preferences and actual payment instrument uses.
Footnotes
1. http://www.mainstreet.com/article/consumers-dont-trust-mobile-payments-cash-remains-most-secure-payment-method
2. http://www.wsj.com/articles/SB125260838282300453
3. http://www.nytimes.com/2015/09/09/upshot/restaurant-of-the-future-service-with-an-impersonal-touch.html
4. http://www.cnbc.com/2014/05/12/one-in-10-americans-dont-carry-paper-money-anymore.html
5. The 2.5 percent growth rate refers to the growth in $1s, $2s, and $5s combined.
7. http://www.bankofcanada.ca/2012/02/discussion-paper-2012-2/
8. https://www.richmondfed.org/publications/research/working_papers/2014/wp_14-09r
9. http://www.bostonfed.org/economic/wp/wp2014/wp1405.htm
10. https://www.bostonfed.org/economic/wp/wp2014/wp1404.pdf
11. https://www.bostonfed.org/economic/rdr/2015/rdr1501.pdf
12. Diary participants were asked for the payment instrument they primarily preferred to use for purchases (i.e. their first choice payment instrument). The Diary also recorded purchase data, the payment instrument used for each purchase, and how much cash participants held at the end of each day.
13. http://www.frbsf.org/publications/fed-notes/2014/april/cash-consumer-spending-payment-diary
14. https://www.nerdwallet.com/blog/credit-cards/millennials-cash-credit-mobile-banking/
15. http://www.huffingtonpost.com/ann-brenoff/generational-differences-caring-cash_b_2442734.html
16. http://www.businessinsider.com/40-of-millennials-would-give-up-cash-completely-2015-10
17. “FedCash” is a trademark or service mark of the Federal Reserve Banks. A complete list of marks owned by the Federal Reserve Banks is available at FRBservices.org.
18. E.g. major holidays, travel seasons, weather-related incidents, etc.
Figure 1: Population Comparisons
Figure 2: Cash Holding by Payment Preference
Figure 3: Primary Payment Instrument Preferences
Figure 4: Age Breakdown of People who Always Hold Cash
Figure 5: Household Income Breakdown
Figure 6: Types of Cash Holders based on Cash Spending Frequency
Figure 7: Age Breakdown of Cash Lovers
Figure 8: Primary Payment Instrument Preferences of Cash Lovers
Figure 9: Household Income Breakdown of General Population vs. Cash Lovers
Figure 10: Age Breakdown of Just-in-Case Holders
Figure 11: Primary Payment Instrument Preferences of Just-in-Case Holders
Figure 12: Income Breakdown of Just-in-Case Holders
Figure 13: Age Breakdown of the Cash-Averse
Figure 14: Primary Payment Instrument Preferences of the Cash-Averse
