Legend goes that when notorious bank robber Willie Sutton was asked why he
robbed banks, he said, because that’s where the money is. When asked why we
should be concerned with the middle neighborhoods of our legacy cities, one practitioner
said, “because that’s where the people are.”
Legacy cities represent a unique subset of American cities because they struggled to
manage a severe loss of manufacturing jobs and experienced significant population loss.1
Legacy cities like Detroit and St. Louis have declined in population by nearly 62 percent
since their peak in the 1950s. Others like Pittsburgh, Baltimore, and Philadelphia lost 55
percent, 34 percent, and 26 percent of their 1950 populations, respectively.
Across legacy cities, middle neighborhoods generally are home to a large share of the
people and households that remain. Although for city leaders, protecting the population
that remains in legacy cities is a strategic priority, they typically have not focused on middle
neighborhoods. Instead, with some exceptions, they are now more focused on high-profile
downtowns that they believe will build the local tax base and create jobs. Middle neighborhoods
generally do not get the attention of nonprofits and community development corporations
(CDCs) either. Such organizations usually focus on the most distressed areas, and
because middle neighborhoods are not the most blighted or highest poverty areas, they typically
do not receive the benefit of federal community development funds. Notwithstanding
the customary lack of attention, middle neighborhoods represent a significant part of the tax
base that supports critical municipal functions.
The decline of federal resources to support community and economic development has
motivated policymakers to use evidence when allocating their increasingly scarce housing
and community development resources. In an environment of limited resources, community
development leaders are challenged to rediscover the value and the importance of middle
neighborhoods.
Our core argument here is that middle neighborhoods in legacy cities are vital because
they are home to a substantial segment of a city’s population and therefore provide the tax
base on which so many city services rely. Further, despite the population decline and job
losses in legacy cities, middle neighborhoods have relatively stable populations. These areas are generally racially mixed, and residents are reasonably well educated, employed, and in
households with modest (or higher) incomes. Moreover, middle neighborhoods tend to be
relatively affordable and, therefore, are generally opportune places for an important segment
of a city’s population. Attention to these places is critical because, we believe, residents of
middle neighborhoods possess the economic wherewithal to have choices, and should the
value proposition for their communities begin to fail, they could exercise those choices and
leave. Underscoring the importance of this notion, Philadelphia’s former mayor John Street
called these neighborhoods the “key battlegrounds”—lose them and you lose the city.2
To explore our argument, this chapter offers a data-based description of the middle neighborhoods
of several legacy cities: Baltimore, Detroit, Milwaukee, Philadelphia, Pittsburgh,
and St. Louis. These are not a random selection of legacy cities; they are cities for which
Reinvestment Fund has completed its Market Value Analyses (MVAs), described below,
within the last five years.3
It is through brief case studies of each of these cities that we
can systematically understand what the middle neighborhoods look like demographically,
socially, and economically. Further, through insights gained from interviews with practitioners
in each of these cities, we explore the strengths, challenges and opportunities for middle
neighborhoods.
A Changing Funding Environment in Legacy Cities
An obvious place to begin a brief review of the historical funding context of these markets
is with the federal Community Development Block Grant (CDBG) program. The CDBG
program has historically been a, if not the, critical source of funds for communities across the
United States to address housing, community and economic development, infrastructure,
and related needs. As Figure 1 shows, between 1975 and 2014, annual federal allocations
have fluctuated substantially, but overall are down 72 percent in inflation-adjusted terms.
Although other sources of funds now support affordable housing (e.g., the Low Income
Housing Tax Credit, which began in 1986), the loss of CDBG is crucial because of the flexibility
in its potential uses.
Figure 1
Annual CDBG Allocations (Raw and Inflation-Adjusted), 1975-2014
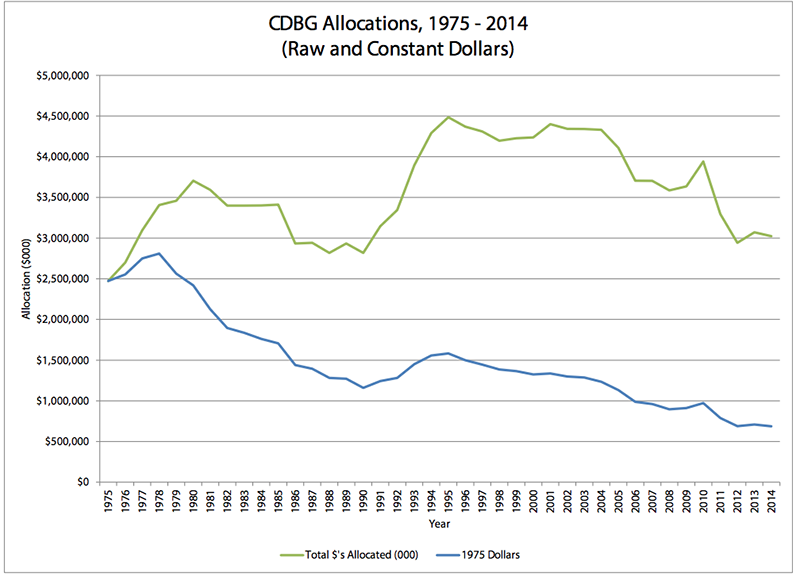
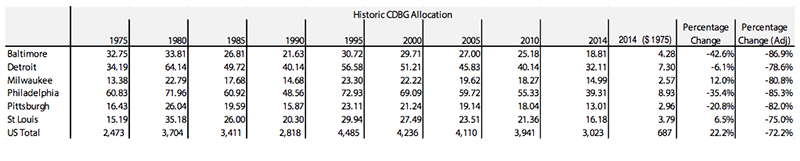
Table 1 presents data on the annual CDBG allocation in the six legacy cities we focus on
here. Between 1975 and 2014, every city except for St. Louis and Milwaukee experienced a
nominal loss in its CDBG allocation. In real terms, although the national average CDBG allocation
declined by 72 percent, the allocations in these selected legacy cities declined from 75
percent in St. Louis to 86.9 percent in Baltimore (in real dollars).4
The implication for cities is
manifest: less federal funding to address critical community and economic development needs.
These cuts may not have had as direct an impact on middle neighborhoods, because, as
more than one interviewee noted, the CDBG regulations and guidance historically made it
difficult to direct CDBG funds to these areas. At the same time, however, the loss of CDBG
funds has meant that more areas are competing for the same shrinking pool of resources.
The relative scarcity of public funds in today’s world of public investment and development
has served to further emphasize the importance of middle neighborhoods when considering
strategic deployment and return on investment of public dollars.
Table 1
CDBG Allocations (million $) 1975-2014
Economic and Demographic Changes in Legacy Cities
In addition to changes in the funding environment, the population and the economy
also changed in legacy cities.5
Others have chronicled the national decline in manufacturing,
and the experience of legacy cities is generally more severe because legacy cities had historically
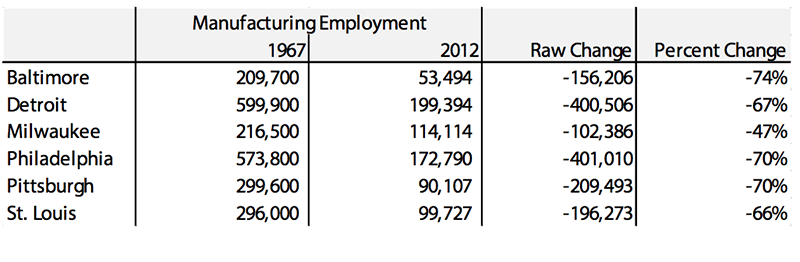
relied more heavily on manufacturing as the bedrock of their local economies. As Table
2 shows, with the exception of Milwaukee, the magnitude of the decline in manufacturing in
legacy cities between 1967 and 2012 is more than double the national average (31 percent).
Table 2
Change in Manufacturing Employment, 1967-20126
The loss of population in these legacy cities was also severe. When city residents move,
they frequently move from the urban core to the suburban counties in the region, and the
movers are typically those who earn higher incomes and have higher educational attainment.
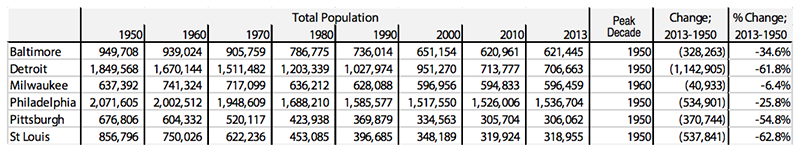
Table 3 presents population data for the six legacy cities from 1950 to 2013. All except
Milwaukee have lost population from their peaks in 1950 (Milwaukee peaked in 1960). Far
and away, Detroit saw the most severe population loss at more than 1.1 million people,
representing 62.3 percent of the 1950 population. St. Louis lost 538,000 people, or 62.8 percent of the 1950 population. Philadelphia experienced a comparable raw population loss
(524,000), which represented 25.8 percent of its 1950 population.
Table 3
Population of Selected Legacy Cities, 1950-2013
Except for Pittsburgh, each of the legacy cities experienced substantial growth in the
number and percentage of minority (especially African American) residents (Table 4 and 5).
The African American population in Pittsburgh declined, but as a percentage of the total
population, it increased.7
Table 4
Black Population of Legacy Cities, 1950-2013
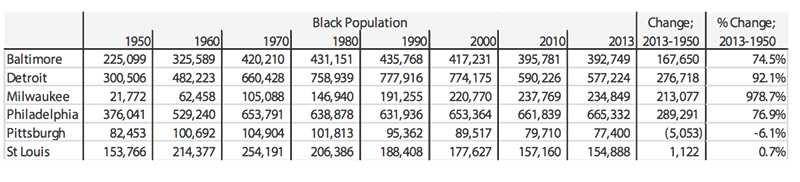
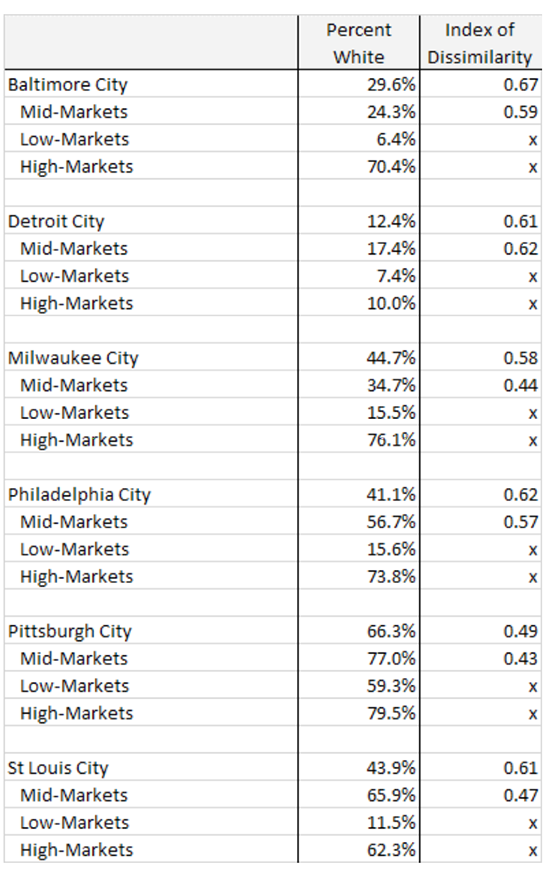
Table 6 shows that middle neighborhoods are generally more representative of the citywide
racial composition than either stronger or weaker MVA market areas. Moreover, these
areas are generally equally or more racially integrated than the city as a whole.8
Table 5
Percentage Black in Legacy Cities, 1950 – 2013
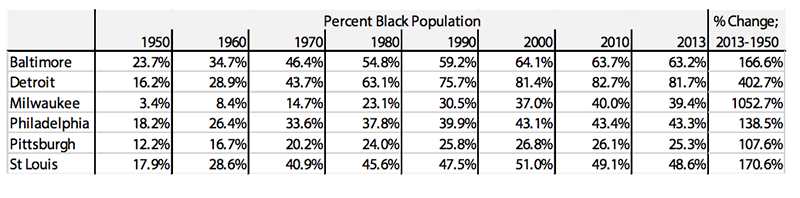
Table 6
Racial Composition and Segregation in Legacy Cities. Lower scores on
the Index of Dissimilarity mean greater integration. See footnote 8.
Using the Market Value Analysis to Identify Middle Neighborhoods and
Target Investment
Although this chapter focuses on middle neighborhoods, it is important to point out that
there is no bright-line definition of a middle neighborhood. One tool cities have used to
identify their middle neighborhoods is Reinvestment Fund’s Market Value Analysis.
Reinvestment Fund first created the MVA in 2001 in support of former Philadelphia
Mayor John Street’s Neighborhood Transformation Initiative.9
The MVA summarizes a set
of market indicators to measure the strength or weakness of the real estate market in individual
areas of a city, ordinarily at a jurisdiction’s census block groups.
Typically, the MVA relies on a set of indicators obtained from the local jurisdictions (i.e.,
administrative data). Usual indicators include median residential sale prices; foreclosures as
a percentage of housing units (or residential sales); variation in sale prices; percentage of all
housing units that are vacant; percent of all parcels that are vacant; percent of (occupied)
housing units occupied by the owner; percent of properties with building permits representing
new construction or substantial rehabilitation; and mixture of land uses. Although
this group of indicators may vary to a degree from city to city, the MVA uses a common set
of indicators that reflect the market conditions that an investor or developer might observe
when evaluating areas for investment or intervention.
Most of these indicators are acquired at an individual address level and then aggregated
to the census block group. Based on experience, the census block group is large enough to
ensure that the data are reasonably stable yet small enough to ensure that the natural mosaic
of a community is revealed.
Although the MVA is not designed to identify middle neighborhoods per se, the results
make clear which areas of a city are strongest, which are most distressed, and which fall in the
middle. We identified MVA markets that, across the spectrum of all local markets, generally
reflect the typical levels of each MVA component indicator.10 Next, we conferred with local
experts in each legacy city to test the appropriateness of our designation of market types as
middle neighborhoods. Although not every expert defined middle market areas exactly as
we did, we achieved a reasonable consensus in most cities. From both of those processes,
we identified the typically three or four MVA market categories that we designated middle
markets, which then we will describe as middle neighborhoods.11
Each of the other market types were then categorized as low if they were in MVA categories
that represented more market stress, and high if they were in categories with less stress. We caution that because of the subjectivity in the designation of middle markets, small
differences between middle markets and the other categories should not be emphasized.
Each of the MVAs presented in this chapter was created within the last five years.12
Data and Methods
The data sources for this chapter are many. As part of the MVA process in each city, we
gathered data from the respective housing or planning department, redevelopment authority,
property assessor, and/or Sheriff. Occasionally, we obtain data from propriety data sources
(e.g., Valassis Lists, First American Real Estate Solutions) when administrative data do not
exist. We also occasionally use census and American Community Survey (ACS) data, but for
a variety of reasons, these are not favored as market indicators for use in the MVA.13
Prior to data aggregation for each MVA indicator, the data components are cleaned and
validated with local subject-matter experts and then through fieldwork, where researchers
review the data by systematically driving through the streets of the MVA city. Often the
researchers are accompanied by local practitioners who have specific knowledge of an issue
(e.g., abandonment and vacant land) or a neighborhood(s).
Finally, researchers use a statistical cluster analysis to combine cases (i.e., block groups),
based on all of the measured indicators, into categories so that each group shares a common
pattern of characteristics. The groupings are designed to maximize the similarity of areas
within groups and maximize the differences between groups. The cluster analysis results are
mapped and validated using a similar field validation process. Additional social, economic,
and demographic characteristics in this chapter are gathered from the decennial censuses of
2000 and 2010 as well as the ACS, 2009-2013 five-year sample estimates.
Middle Neighborhoods14
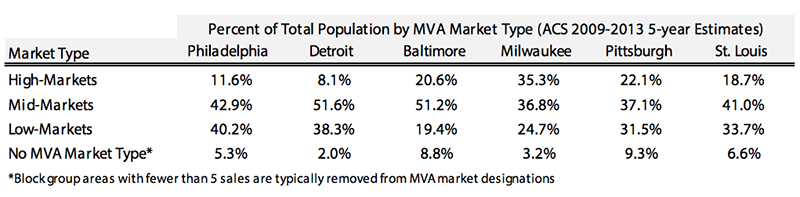
Across each of the studied cities, the middle neighborhoods are home to the largest
segment of the population. In Detroit and Baltimore, more than one-half of the population
resides in the MVA middle neighborhoods as defined by the MVA; Philadelphia’s and St.
Louis’ middle neighborhoods are home to more than 40 percent, while Milwaukee and Pittsburgh
house approximately 37 percent (Table 7).
Table 7
Population Distribution by Market Type
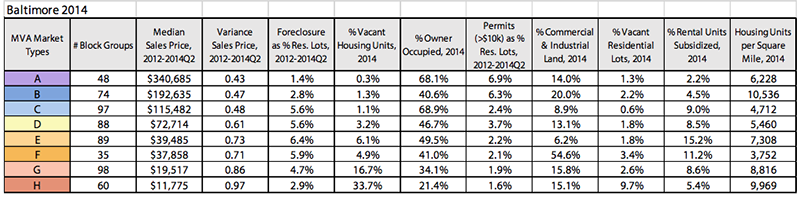
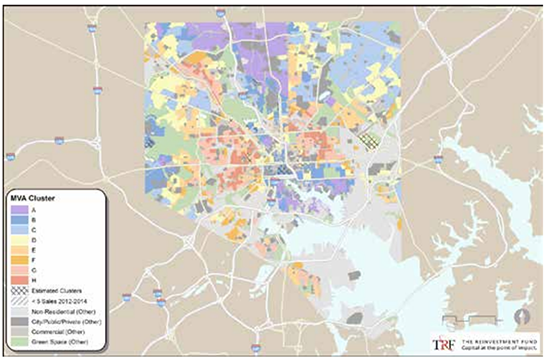
Baltimore: Reinvestment Fund created multiple MVAs dating to 2005 in Baltimore. The
most current MVA (Table 8) presents a similar but not identical portrayal of Baltimore’s
housing market than previous MVAs. Aside from pockets of market stabilization and
improvement (e.g., the Fells Point and Canton sections on the Patapsco River or Patterson
Park to the north of Canton) and entrenched distress (e.g., Sandtown/Winchester and Park
Heights) much of Baltimore shows modest strength or modest decline.
Baltimore’s middle neighborhoods are home to 318,000 residents, equal to 51.2 percent
of Baltimore’s total population. Seventy-seven percent of residents are nonwhite in middle
neighborhoods. Notwithstanding the relatively reasonable price of housing in Baltimore and
modest income levels, owner, and especially renter, cost burdens are elevated. In fact, costburden
levels for Baltimore’s middle neighborhoods look more like their distressed counterparts
than they do the stronger areas where incomes are substantially higher and the level of
poverty is well below the citywide average. Residents of Baltimore’s middle neighborhoods
tend to be reasonably well educated, certainly when compared with residents of the more
distressed market areas.
Sales prices in Baltimore’s middle neighborhoods range between $40,000 and $115,000—a
wide range but still affordable to households earning a modest annual income. These middle
neighborhoods face significant pressure from foreclosures and are not undergoing significant
maintenance or upgrading as evidenced by low levels of permitting. Middle neighborhoods
in Baltimore are where renters with subsidies are finding homes, although they tend to be
in the lower-priced areas of the markets. We note also that these areas run the full range of
owner occupancy.
Driving through Baltimore’s middle neighborhoods, one sees a full array of Baltimore’s
housing style, quality, level of maintenance, tenure, price points, and general curb appeal.
But mostly, they represent places where modest-income families can find a home to meet
their basic needs. At the same time, it is clear that maintenance is deferred in some of
the market areas, conditions that most certainly undermine housing values and community
stability.
Table 8
Characteristics of Baltimore’s Markets
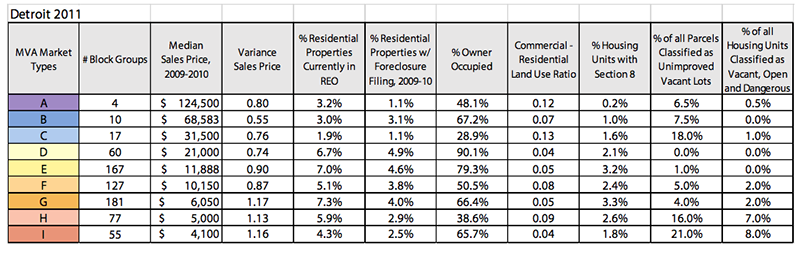
Detroit: Detroit’s MVA (Table 9) was completed at a time when a state takeover and the
potential bankruptcy of Detroit was becoming increasingly likely. Home prices in Detroit
are substantially lower than in any of the other legacy cities. Even at the strongest end of the
market, homes were selling for prices averaging under $125,000. Homes in Detroit’s most
distressed areas averaged under $5,000.
Like Baltimore, Detroit’s middle neighborhoods are home to more than 50 percent of
its population. There is no substantial difference in racial composition across the Detroit
market categories. Although Detroit lost a significant percentage of its population, the
losses in middle neighborhoods were substantially less severe, even compared to its strongest
markets. Middle neighborhoods have a higher proportion of owner-occupied housing
than even Detroit’s strongest markets. This is a function of the relatively recent conversion
and rehabilitation of housing stock in the downtown and midtown areas, much of which is
now renter-occupied. Owner cost-burdens (including the extremely cost burdened) for those
residing in the middle neighborhoods of Detroit is relatively low compared with other parts
of the city. Adult residents of Detroit’s middle neighborhoods have reasonably similar levels
of education as their counterparts in the stronger market areas. Although Detroit’s poverty
rate is generally higher than other legacy cities, the city’s poverty rate in middle neighborhoods
is relatively low.
The high level of real estate owned (REO) homes (those held in the inventory of investors
after foreclosure), homes pending mortgage foreclosure actions, as well as the amount
of vacant land (created through demolition) are an obvious drag on the value and desirability
of Detroit’s middle neighborhoods. But, consistent with other legacy cities, several of
the middle areas are highly owner-occupied. Further, middle neighborhoods have a higher
proportion of the rental stock occupied by renters with a subsidy. Subsidized renters who
live in middle neighborhoods are fortunate because these areas are some of the most stable
places in Detroit.
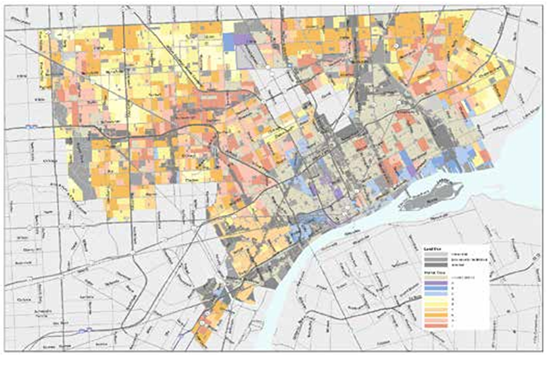
Compared with other legacy cities for which we have completed MVAs, Detroit is unique
in that the physical distance between areas of market strength and distress is extremely small,
sometimes the width of a single street. It is clear that the city’s middle neighborhoods (e.g.,
East English Village, Grandmont, Rosedale, Sherwood Forest) are places where families dedicate significant effort to maintain their communities, despite everything going on around
them. A home in pristine condition with a perfectly manicured lawn next to a burned-out
structure is a common sight. It is here that signs frequently notify passers-by that a town
watch is active. Many of the communities also appear to have worked to maintain their
historic identity. However, more than in the other legacy cities, vacancy and abandonment
(and apparent vacancy caused by fire or demolition) and properties warehoused in a lender
or investor’s REO portfolio are manifest.
Table 9
Characteristics of Detroit’s Markets
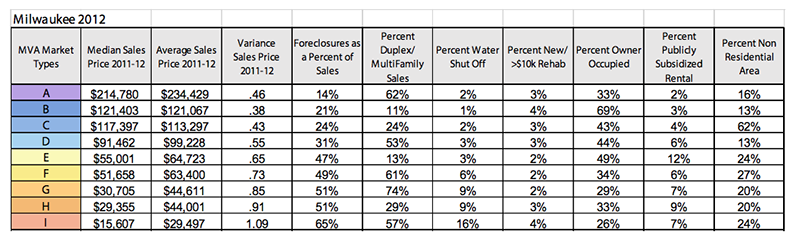
Milwaukee: Milwaukee’s middle neighborhoods are home to approximately 37 percent of
the city’s population, generally lower than other legacy cities. However, a substantially larger
share of the Milwaukee population resides in stronger markets and a smaller population is in
distressed market areas. Milwaukee’s middle neighborhoods are places with modest levels of
owner occupancy and a substantial percentage of sales of duplexes and other small multifamily
units (Table 10). Middle neighborhoods are still being affected by foreclosures although, unlike
other legacy cities, Milwaukee’s more distressed markets are now being hit harder.
Milwaukee’s population was stable between 2000 and 2013, with the middle neighborhoods
growing by 1.7 percent. The largest proportionate loss was found in the more
distressed market areas of Milwaukee. Milwaukee is similar to the other legacy cities in that a
substantial share of the city’s non-white population lives in middle neighborhoods. Though
sales prices are relatively low, Milwaukee’s middle neighborhoods are not particularly affordable
for owners or renters. A relatively high percentage of residents are cost burdened.
Milwaukee’s middle neighborhoods are split: markets with homes prices ranging from
$90,000 to $120,000 and those, albeit often similar in appearance, with home prices from
$50,000 to $70,000. Some of this bifurcation may be related to Milwaukee’s legacy of racial
segregation. However, some of the price difference can also be accounted for by the much
higher levels of foreclosure activity in the less expensive neighborhoods. History tells us
though that segregation and foreclosures are not unrelated phenomena.
Table 10
Characteristics of Milwaukee’s Markets
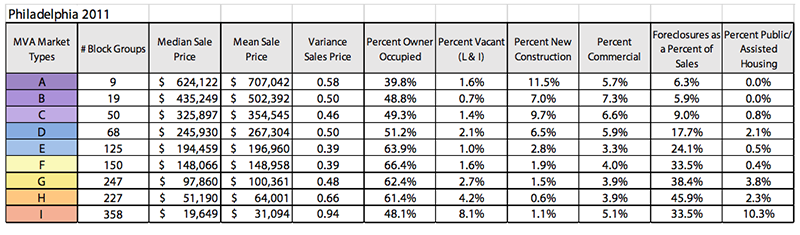
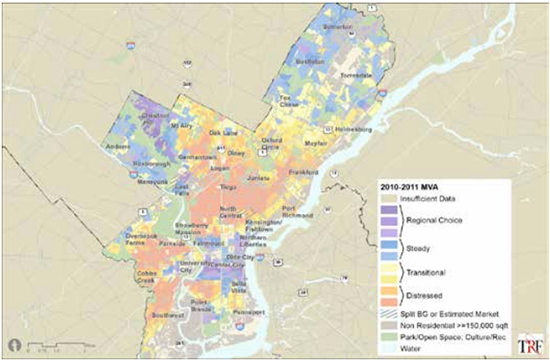
Philadelphia: Overall, 42.9 percent of Philadelphia’s residents (663,000) live in the
middle neighborhoods, a 4.6 percent rise over the decade. The nonwhite population of Philadelphia
is over-represented in the more challenged market areas of Philadelphia. Although
47.8 percent of the residents in middle neighborhoods are nonwhite, disproportionately
fewer (32.3 percent) of nonwhites live in middle neighborhoods.
Philadelphia stands out among the group of legacy cities in a number of ways. First, it has
the largest population. Second, a considerable share of Philadelphia’s residential population
resides in the strong market areas in the downtown. Third, Philadelphia’s residential downtown,
along with a few communities, particularly in the northwest section, have sale prices
well over $600,000 (price points not frequently observed in the other cities). The middle
neighborhoods, however, are relatively affordable and are unmistakably Philadelphia’s
owner-occupied communities (Table 11). New construction is rare in these areas; however,
that which is new will be found largely in the northwest and the far northeast sections of
the city. Mortgage foreclosures continue to affect these areas; a second wave related to the
recession came on the heels of a significant number of foreclosures in the early 2000s due to
to subprime mortgages and abusive lending practices. Unlike some of the other legacy cities,
middle neighborhoods in Philadelphia are largely absent renters with subsidies. Those renters
are generally clustered in the most distressed markets.
Philadelphia’s middle neighborhoods are home to 50 percent of all owners, and these
areas have the highest typical owner occupancy rate at 62.1 percent. Notwithstanding the
prices in Philadelphia’s strongest markets, Philadelphia’s middle neighborhoods are relatively
affordable compared with the other legacy cities as evidenced by the relatively low levels of
owner and renter cost burdens (among the cities examined, only Pittsburgh and St. Louis
have lower levels of cost burdens). It is interesting to note just how different residents of
Philadelphia’s middle neighborhoods are from their stronger market counterparts. Of adults
in middle areas, 23.2 percent have a college degree compared with 62.2 percent of those in
the stronger markets. Such a stark difference is found only in Baltimore.
Philadelphia’s middle neighborhoods are staunchly middle-class communities. Many of
the residents earn a modest income. The most recent wave of foreclosures has visibly affected many of these communities and can be seen in the presence of REOs, especially in the more
challenged parts of the middle areas. The poor quality of Philadelphia’s schools hits these
communities particularly hard. Unlike residents of the stronger markets, residents of middle
neighborhoods generally cannot afford private schools, and public charter schools generally
admit through lottery, not residence. The tenuousness of these communities is manifest,
especially in the lower end of the middle areas.
Table 11
Characteristics of Philadelphia’s Markets
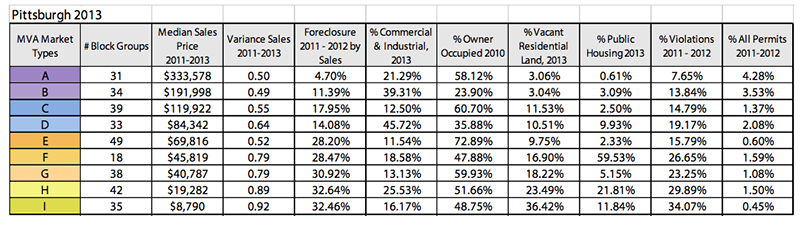
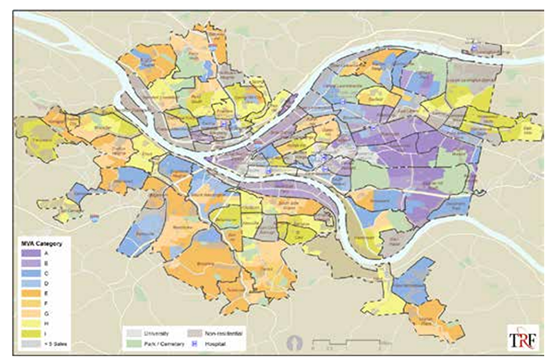
Pittsburgh: Of all legacy cities, Pittsburgh’s middle neighborhoods are home to the
lowest percentage of the city’s population (37.1 percent). In some ways, this is a manifestation
of the even distribution of the city’s populations across all markets. Although Pittsburgh’s
population declined by almost 10 percent between 2000 and 2013, the middle neighborhoods
fared reasonably well, losing only 5.3 percent of their population. We find a disproportionately
large percent of Pittsburgh’s white population in these areas (43 percent) and a
disproportionately smaller percentage of its nonwhite population in middle neighborhoods
(26.2 percent).
Pittsburgh’s middle neighborhoods have home sale prices that are affordable even for
those of fairly modest means (Table 12). In general, the city’s middle neighborhoods have
the highest levels of owner occupancy, higher even than the stronger market areas. One MVA
middle market type is home to a significant group of subsidized rental properties. Foreclosures
in Pittsburgh are elevated in the middle neighborhoods, and like some of the other
legacy cities, the REO inventory is readily visible to the casual observer.
Owing to the very low home sale prices, the cost-burden in Pittsburgh’s middle areas is
relatively low compared to the other legacy cities. Cost-burdens are also relatively low among
renters living in middle neighborhoods.
The educational profile of Pittsburgh’s adult population residing in middle neighborhoods
is the most advantageous among these legacy cities. Approximately one-third of
middle area residents have bachelor’s degrees and fewer than 9 percent lack a high school
diploma. The poverty rate for residents of middle neighborhoods is notably lower than the
other legacy cities.
In validating Pittsburgh’s MVA, we were struck by how stable and advantageous the
city’s middle areas were, and how few residents have fully exploited the many extraordinary
physical elevations and view sheds the city has to offer. Homes on a hill with an unobstructed
view of the rivers that in other cities might be million dollar tear-downs sell for
under $35,000, for example. Several of the communities along the Allegheny River have
market momentum, and the East Liberty section is showing substantial market strength. Like
some of the other legacy cities, the impact of the universities and medical centers is readily
apparent in the surrounding real estate markets.
Table 12
Characteristics of Pittsburgh’s Markets
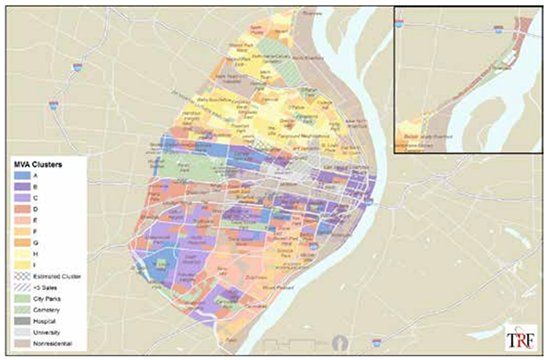
St. Louis: St. Louis’s middle neighborhoods are home to 41 percent of its population.
These areas lost 8.2 percent of their population during the last decade while the stronger
market areas gained 10.7 percent. However, the city’s most distressed markets—home to onethird
of the population—lost 18.4 percent. The racial segregation in St. Louis is manifest in
these markets. For example, although 60.7 percent of the white population lives in middle
neighborhoods, only 36.8 percent of the nonwhite population lives in these areas.
The middle neighborhoods of St. Louis are largely in the southern part of the city, south
of Dr. Martin Luther King Blvd. Like the other legacy cities, St. Louis’s middle areas have
comparatively low sale prices, making them reasonably affordable to both owners and
renters. These are markets with high levels of foreclosures and a substantial level of investor
activity (Table 13). As observed in other legacy cities, owner occupancy is generally highest
in the middle neighborhoods. Like Detroit, vacant housing and land are common and have
an obvious impact on community life. Subsidized rental housing, like other legacy cities, is
more common in some of the middle neighborhoods, although there is a significant concentration
in the city’s most challenged market areas.
The adult population is relatively well educated in these middle neighborhoods compared
with other legacy cities. One-third have bachelor’s degrees, second only to Pittsburgh.
Further, fewer than 15 percent failed to graduate from high school, again second only to
Pittsburgh. St. Louis’s middle areas have a poverty rate of 15 percent, a rate slightly above
the city’s stronger markets (13.5 percent).
Rehabilitation and redevelopment are consistent with the historic character of the city.
Moreover, the quality of public facilities (i.e., parks and libraries) is amazingly high and
consistent across the city, regardless of the challenges or strengths of the real estate markets.
Although some of the most expensive real estate in St. Louis is adjacent to the city’s Forest
Park, there are several middle neighborhoods ringing the southern border of that same park.
Even on the north side where the residential market is weaker, middle neighborhoods are
adjacent to several of the city’s parks. At the same time, like the other legacy cities, many of
the middle areas are hanging on, apparently challenged by the elevated levels of investor-owned
property.
Table 13
Characteristics of St. Louis’s Markets
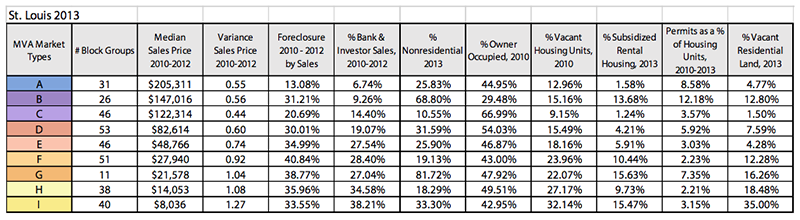
Table 14
Demographic Characteristics of MVA Market Types
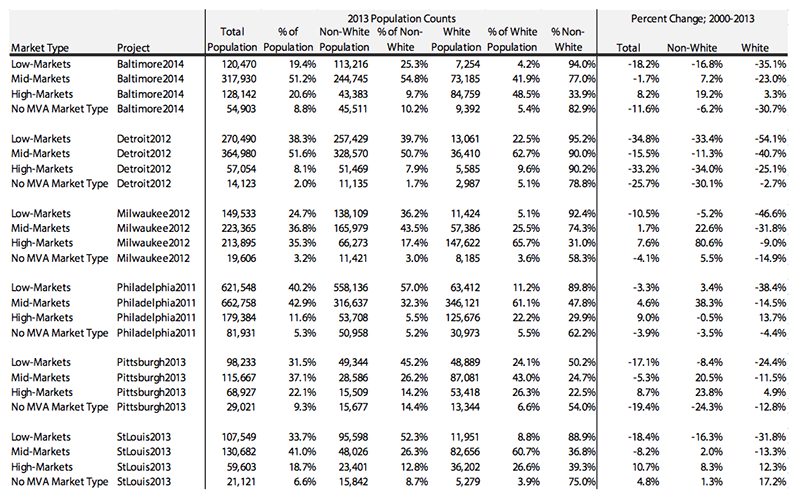
Table 15
Housing Characteristics of MVA Market Types
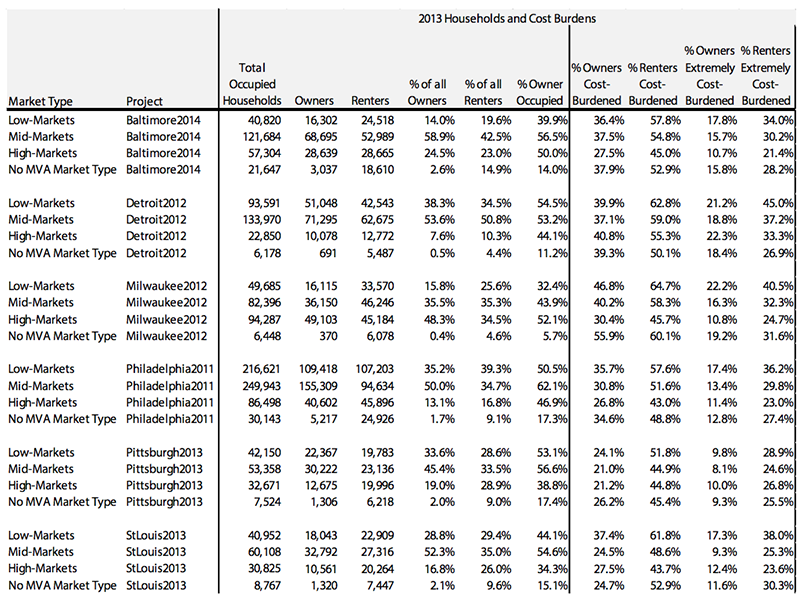
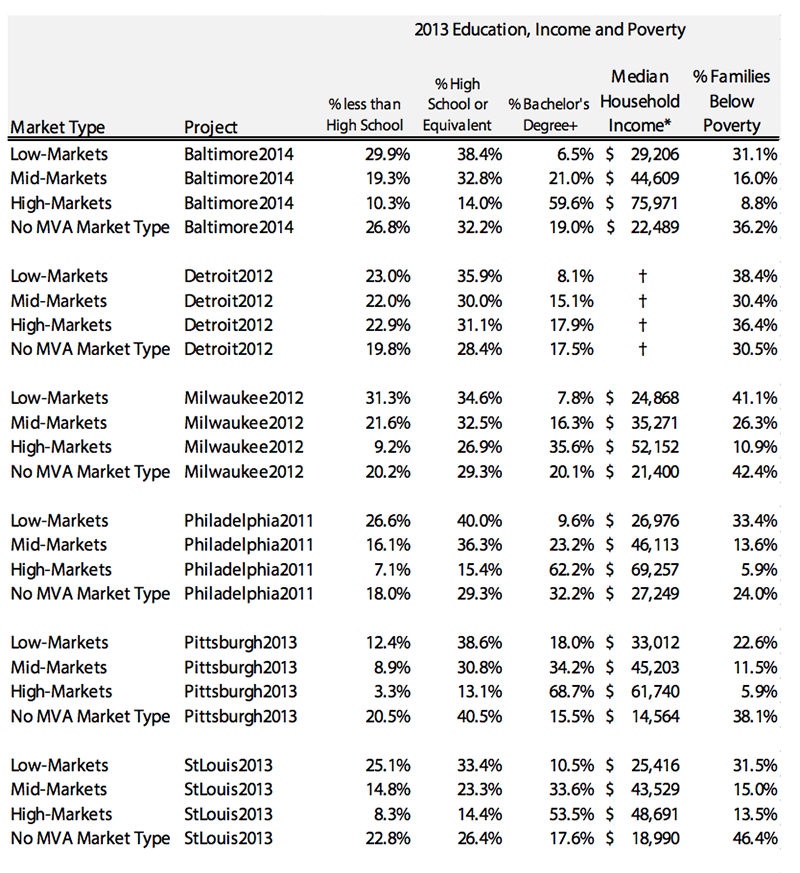
Table 16
Education, Income and Poverty of MVA Market Types
Discussion
Economist Charles Tiebout is credited
with popularizing the concept of the
value proposition.15 For policymakers
and elected officials in legacy cities, it is a
vital proposition for the middle neighborhoods.
To reverse the loss of population,
legacy cities must nurture the conditions
and amenities that attract and retain residents.
VALUE PROPOSITION.
Attracting new residents
and retaining those who currently
live in the city requires an effective “value
proposition.” For Detroit, this proposition
is firmly based on offering a high quality
of life that is well within each resident’s
grasp. This is arguably a proposition
the city has not been able to effectively
make. People make decisions about cities
based on what their neighborhoods offer,
including access to employment opportunities,
quality schools, efficient and
effective public services, housing options,
safety and security, and affordability.
Detroit must deliver on these to make
itself truly regionally competitive—where
area residents, city residents, and those
coming to the region for the first time can
truly see themselves, and in many cases
their families, living in Detroit.
Detroit Future City, 2012 Detroit Strategic
Framework Plan (2nd printing). (Detroit: Inland
Press, 2013), p. 478.
In many ways, middle neighborhoods
have the strongest value proposition for
residents, at least for now. Middle neighborhoods
contain an attractive housing
stock and their homes are reasonably
affordable to middle- and modest-income
families.
Middle neighborhoods in each of
the legacy cities manifest both market
strengths and challenges. In many of the
legacy cities, the middle neighborhoods
are where racial-ethnic diversity is strong
and modest-income families can live in a
relatively opportune area. But, residents of
middle neighborhoods also have relatively
advantageous levels of education and
income, which means they may have other options of where to live.
Accordingly, middle neighborhoods are also, in many ways, in the most precarious position.
Local experts and practitioners pointed out that middle neighborhoods are the areas
with the most to lose, and the farthest to fall when confronted with continued strain on
residential markets.
One of the complications of working in middle neighborhoods is that cities are forced to
simultaneously play offense and defense. A public official in one city noted the dual role that
middle neighborhoods play as both nodes of strength for their surrounding neighborhoods
and as fragile areas on the verge of decline. “If your neighborhood is close to strength, then
you’re really hoping to have positive bleed over. Where your neighborhood is surrounded by
weaker areas, I could see folks thinking, ‘now might be the time to get out.’”
Middle neighborhoods are areas where, in the words of one interviewee, “One or two
boarded up houses on a block” can be the difference between a neighborhood on the rise
or one falling into distress. This means that for cities with limited resources, investing in the
middle neighborhoods can often produce the largest returns. In the words of a community
development expert, “If you ignore these places, then you’ll continue to see declines.”
Stated differently, middle neighborhoods are where the real estate market continues to
operate within market expectations while also providing homes within reach for low- and
middle-income families. In contrast, distressed market areas have experienced market fallout
and collapse, signaled by very few home sales or residential property turnover.
“Areas with relatively strong market
activity should be targeted for investment,
with the goal of increasing
demand, strengthening property values,
and rebuilding confidence in the
community. Focusing resources on these
places, which may include residential
neighborhoods, commercial districts,
and/or downtowns, can motivate
existing property owners to reinvest in
their properties, and encourage people
to buy in the area.”
A. Mallach, Rebuilding America’s Legacy
Cities: Report of the 110th American
Assembly (New York: The American
Assembly, Columbia University, 2012), p. 329
One of Reinvestment Fund’s operating
assumptions, developed over the 15-year
history of the MVA, is that, owing in part
to the scarcity of available housing subsidies,
what subsidy does exist cannot alone
create a market. Rather, subsidies should
be used strategically to leverage private
market forces, clearing barriers to private
actors, and thereby multiplying the impact
of public dollars in a given neighborhood.
One interviewee noted, “These are places
where your neighborhood is not so far
gone that it takes decades or millions of
dollars to see something change.” Middle
neighborhoods provide an opportunity to
make targeted and focused investments,
the result of which will be readily apparent.
As another interviewee noted, focusing
on middle neighborhoods is the nexus of
bringing private-sector discipline to publicsector
practice: “Of course these [middle markets] are the places that you want to invest.”
For Legacy Cities, the health of middle neighborhoods is more important than ever.
In his address to the 2013 Federal Reserve Bank of Richmond Community Development
Conference, Jeremy Nowak pointed to the dangers middle neighborhoods face. “Demographics,
economics potentially, and cultural factors have given some advantages to cities,”
he said, “including cities that are relatively distressed and have been quite distressed for 40
or 50 years.” Residents, he said, “are now willing to pay more if they have access to certain
things.” Nowak warned, “if the relationship between quality and cost does not work, then they will opt out.”16
In describing the condition in
Youngstown, OH, Mallach and Brachman
write:
“Youngstown Neighborhood Development
Corporation focused its resources
on neighborhoods that, although
troubled, were still vital and potentially
capable of regeneration … There are
strong arguments to prioritize such areas
over attempts to pursue the large-scale
reconfiguration of mostly abandoned
areas. Legacy cities like Youngstown are
now seeing extensive and often rapid
destabilization of traditional neighborhoods
like Idora; absent concerted efforts
to reverse this trend, some cities may
be left with few viable neighborhoods
outside their downtown and near-downtown
cores. This is a matter of far more
urgency for the future viability of legacy
cities than repurposing land in largely
vacant areas…”
A. Mallach and L. Brachman, Regenerating
America’s Legacy Cities (Cambridge, MA:
Lincoln Institute of Land Policy, 2013), p.52.
These words speak to the importance of
supporting middle neighborhoods in our
legacy cities, and are echoed by a recent
Pew Research study of millennials in Philadelphia.17
Pew’s research suggests that this
younger generation was more likely than
older generations to leave Philadelphia
because of quality of life and opportunity
issues (i.e., public safety, career opportunity,
public education). At some point in
the future, as millennials age, get married,
and have children, the importance of safe
streets and good schools will increase and
these “consumer-voters” (in Tiebout’s
parlance) will leave. For middle neighborhoods,
the failure to address these core
issues may leave residents with few reasons
to stay. For legacy cities, losing the battle
in these places will have systemic and longlasting
effects.18
We return to the initial premise. Federal
funds for neighborhood improvement
have declined significantly during the past
40 years, and many of our public institutions
and systems (e.g., public safety, public
education, local government service, and
infrastructure) are not where they need to
be. Our officials are overly focused on the downtowns, and they are competing vigorously for high-profile, but spatially compact, revitalization
opportunities for distressed neighborhoods (e.g., CHOICE Neighborhoods and
Promise Zones). Middle neighborhoods are not a priority. The fundamentals that support
stability, opportunity, and quality of life are important to all city residents. But they are
uniquely important to residents of middle neighborhoods.
Lastly, middle neighborhoods in these legacy cities are most representative of citywide
racial composition and generally more integrated than the city itself or the other market
types. Although we have argued that it is good public policy to use public funds to invest
in middle neighborhoods from a community development or neighborhood improvement
perspective, middle neighborhoods may also be important targets for public investment
because they are places where opportunity is high and racial integration greatest.
Without a clear space in the public policy and investment conversations, the future of
middle neighborhoods as areas of opportunity is in doubt. If Tiebout is correct, cities ignore
their middle neighborhoods at their own peril. Unless policymakers recognize and act to
maintain the quality of life and stability of these areas, residents may well leave because their
economic wherewithal allows them to find those qualities elsewhere.
About Reinvestment Fund
Reinvestment Fund is a national leader in rebuilding America’s distressed towns and
cities through the innovative use of capital and information. A CDFI, Reinvestment Fund
has made more than $1.7 billion in community investments since 1985 and is supported by
nationally trusted research and policy analysis.
The authors of this chapter would like to thank the JP Morgan Chase Foundation for its support.
1. See, for example, http://www.legacycities.org/
2. City of Philadelphia, “Neighborhood Transformation: A Strategy for Investment and Growth” (2001).
3. Alan Mallach and Lavea Brachman rank legacy cities from 1 to 18 based on a variety of demographic, social,
and economic characteristics (with 1 being the strongest rank). Using their scale, the cities in this chapter
represent the wide range of conditions among legacy cities. Philadelphia is ranked 1, Pittsburgh, 2, Baltimore,
3, Milwaukee, 5. St. Louis, 8 and Detroit, 17. See A. Mallach and L. Brachman, Regenerating America’s
Legacy Cities (Cambridge, MA: Lincoln Institute of Land Policy, 2013).
4. When the federal government consolidated existing categorical grants into the CDBG program, cities were
held harmless against a loss of funding. The expiration of the hold harmless program and the introduction
of new census data in 1980 led to a number of large funding fluctuations apparent in the 1975 and 1980
allocations. Personal communication with Todd M. Richardson, associate deputy assistant secretary, Office of
Policy Development and Research, U.S. Department of Housing and Urban Development, 2015.
5. See, for example, http://www.legacycities.org/
6. See American Fact Finder, “Manufacturing: Geographic Area Series: Industry Statistics for the States,
Metropolitan and Micropolitan Statistical Areas, Counties, and Places: 2012 & 2012 Economic Census of the
United States.” (Washington, DC: U.S. Census), at http://factfinder.census.gov/faces/tableservices/jsf/pages/
productview.xhtml?pid=ECN_2012_US_31A1&prodType=table. See also: ftp://ftp2.census.gov/econ1977/
Graphic_Summary_of_the_1977_Economic_Censuses.pdf
7. Thomas notes that this is not an uncommon pattern observed in legacy cities. She argues that understanding
this trend is critical to developing proactive strategies in these cities that are attentive to fundamental social
justice issues. J.M. Thomas, “Addressing the Racial, Ethnic, and Class Implications of Legacy Cities.” In
Rebuilding America’s Legacy Cities: New Directions for the Industrial Heartland, edited by Alan Mallach (New York:
American Assembly, Columbia University, 2012).
8. The Index of Dissimilarity (“D”) measures how evenly two groups are distributed across a geographic area,
with lower values representing higher levels of integration. D values literally translate into the percent of a
population (e.g., African American) that would need to move to achieve a uniform (i.e., integrated) area. In
every city but Detroit, the index is lower in middle market areas than a city’s total score. See: O. Duncan and
B. Duncan. “A Methodological Analysis of Segregation Indices.” American Sociological Review 1955 Vol. 20
Pg.210-17.
9. For a more thorough description of the MVA’s history and applications, see I. Goldstein, “Making Sense
of Markets: Using Data to Guide Reinvestment Strategies.” In What Counts: Harnessing Data for America’s
Communities (San Francisco: Federal Reserve Bank of San Francisco and the Urban Institute, 2014).
10. The general approach for designating middle markets for this analysis was to include markets that had
characteristics that, taken together, were within about 50 percent to 200 percent of the citywide average.
11. In our experience, established neighborhood boundaries are typically comprised of more than one MVA
market type.
12. Data were most recently collected in the following years: Baltimore (2012-14), Detroit (2010-11), Milwaukee
(2011-12), Philadelphia (2010-11), Pittsburgh (2011-13), and St. Louis (2010-12). It is frequently not possible
to obtain each MVA data element entirely coincident in time. Moreover, for several indicators (e.g.,
residential sales or mortgage foreclosures) we will oftentimes aggregate across multiple years in an effort
to obtain a sufficiency of activity upon which a stable estimate can be made. The years noted for each city
therefore are presented as an indicator of the period for which the MVA is most representative.
13. ACS data are generally not preferred for MVAs because the margins are error are often quite large and the
5-year aggregation makes the data less contemporary than other critical indicators.
14. Tables 14, 15 and 16 contain the demographic data for all cities.
15. C.M. Tiebout, “A Pure Theory of Local Expenditures,” Journal of Political Economy, 64(5)(1956): 416-424.
16. Jeremy Nowak, “Redefining ‘Rust Belt’: An Exchange of Strategies by the Cities of Baltimore, Cleveland,
Detroit and Philadelphia,” presentation at the Federal Reserve Bank of Richmond, Community Development
Conference, June 2013, Baltimore, MD. Available at http://jnowakassociates.com/publications/.
17. Pew Research, “Millennials in Philadelphia: A promising but fragile boom” (Washington, DC: Pew Research,
2014), at www.pewtrusts.org/en/research-and-analysis/reports/2014/01/21/millennials-in-philadelphia-apromising-but-fragile-boom.
18. Brophy’s analysis of Baltimore’s neighborhoods concludes with a set of recommendations that both prioritize
the city’s middle markets and offer a promising programmatic approach to working in these areas. Specifically,
the multifaceted Baltimore’s Healthy Neighborhoods initiative exemplifies a demonstrably impactful and
“cost-effective approach to strengthening middle neighborhoods.” Paul Brophy, Great Neighborhoods Great
City: Strategies for the 2010s (2012 update). (Baltimore, MD: Goldseker Foundation, 2012), p. 24, at www.
goldsekerfoundation.org/uploaded_files/0000/0023/great_cities_2012.pdf.
Appendix 1: MVA Maps
Appendix 1, Figure 1
Baltimore MVA
Appendix 1, Figure 2
Detroit MVA
Appendix 1, Figure 3
Milwaukee MVA
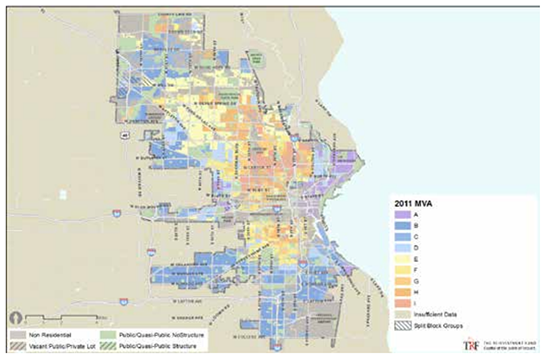
Appendix 1, Figure 4
Philadelphia MVA
Appendix 1, Figure 5
Pittsburgh MVA
Appendix 1, Figure 6
St. Louis MVA
Appendix 2: Chapter Interviewees
Brian Abernathy – First Deputy Managing Director at City of Philadelphia. Formerly served as Executive Director
of the Philadelphia Redevelopment Authority.
Martha Brown – Deputy Commissioner, Milwaukee Department of City Development.
Kathryn Dunn – Vice President, Community Investment at the Greater Milwaukee Foundation.
Jeff Hebert – Chief Resilience Officer and Executive Director of the New Orleans Redevelopment Authority.
Karla Henderson – Director of Strategic Plannng and Facility Management at Wayne County Michigan and former
Group Executive of Planning & Facilities for the City of Detroit.
Steve Janes – Assistant Commissioner of Research and Compliance for the City of Baltimore Housing Department.
Don Roe – Director of the Planning and Urban Design Agency, the City of St. Louis.
RJ Stidham – A community development consultant, who has worked with a number of cities on their development
and implementation of the MVA, including Detroit and St. Louis.
Kyra Straussman – Director of Real Estate, The Urban Redevelopment Authority of Pittsburgh.
Ira Goldstein is the President of Policy Solutions at Reinvestment Fund. His research focuses on various
aspects of housing and economic development in America’s cities. Prior to joining Reinvestment
Fund, Goldstein was Mid-Atlantic Regional Director of Fair Housing and Equal Opportunity at the
US Department of Housing and Urban Development. For more than 25 years, Goldstein has been a
Lecturer at the University of Pennsylvania, teaching courses focused on housing policy and social science
research methods and statistics. Goldstein holds a PhD, MA and BA from Temple University.
Jacob L. Rosch is a Research Associate at Reinvestment Fund. His research focuses on residential
housing markets, intersections between health and housing, and education. Prior to joining Reinvestment
Fund, Mr. Rosch spent six years as a researcher and consultant advising educational institutions
in K-12 and higher education. He holds a BA with honors from the University of North Carolina at
Chapel Hill and an MPP from the University of Chicago’s Harris School of Public Policy.
William Schrecker has been a Research Analyst at Reinvestment Fund since 2013, with much of his
work focused on residential real estate analyses. His recent MVA projects include Baltimore, New
Orleans, and Wilmington, DE, with past research including Houston, Pittsburgh, and St. Louis.
Mr. Schrecker holds a Master’s of Business Administration from the Fox School of Business at Temple
University and a Master’s of Social Work from the University of Pennsylvania.