Historical data indicate a strong relationship between the age distribution of the U.S. population and stock market performance. A key demographic trend is the aging of the baby boom generation. As they reach retirement age, they are likely to shift from buying stocks to selling their equity holdings to finance retirement. Statistical models suggest that this shift could be a factor holding down equity valuations over the next two decades.
The baby boom generation born between 1946 and 1964 has had a large impact on the U.S. economy and will continue to do so as baby boomers gradually phase from work into retirement over the next two decades. To finance retirement, they are likely to sell off acquired assets, especially risky equities. A looming concern is that this massive sell-off might depress equity values.
Many baby boomers have already diversified their asset portfolios in preparation for retirement. Still, it is disconcerting that the retirement of the baby boom generation, which has long been expected to place downward pressure on U.S. equity values, is beginning in earnest just as the stock market is recovering from the recent financial crisis, potentially slowing down the pace of that recovery.
This Economic Letter examines the extent to which the aging of the U.S. population creates headwinds for the stock market. We review statistical evidence concerning the historical relationship between U.S. demographics and equity values, and examine the implications of these demographic trends for the future path of equity values.
Demographic trends and stock prices: Theory
Since an individual’s financial needs and attitudes toward risk change over the life cycle, the aging of the baby boomers and the broader shift of age distribution in the population should have implications for capital markets (Abel 2001, 2003; Brooks 2002). Indeed, some studies attribute the sustained asset market booms in the 1980s and 1990s to the fact that baby boomers were entering their middle ages, the prime period for accumulating financial assets (Bakshi and Chen 1994).
However, several factors may mitigate the effects of this demographic shift. First, demographic trends are predictable and rational agents should anticipate the impact of these changes on asset demand. Consequently, current asset prices should reflect the anticipated effects of demographic changes. In addition, retired individuals may continue to hold equities to leave to their heirs and as a source of wealth to finance consumption in case they live longer than expected (e.g., Poterba 2001).
Foreign demand for U.S. equities might also reduce the downward pressure on asset prices. However, the effect is probably limited for two reasons. First, other developed nations have populations that are aging even more rapidly than the U.S. population (Krueger and Ludwig, 2007). Second, there is substantial evidence of home bias in equity holdings. Individual investors typically hold disproportionate shares of domestic assets in their portfolios. For example, in 2009, the foreign equity holdings of U.S. investors were only 27.2% of the share of foreign equities in global market capitalization. While the low level of international equity diversification is still not well understood (Obstfeld and Rogoff 2001), it suggests that foreign demand for U.S. equities is unlikely to offset price declines resulting from a sell-off by U.S. nationals.
Demographic trends and stock prices: Some evidence
To examine the historical relationship between demographic trends and stock prices, we consider a statistical model in which the equity price/earnings (P/E) ratio depends on a measure of age distribution (for another example, see Geanakoplos et al. 2004). We construct the P/E ratio based on the year-end level of the Standard & Poor’s 500 Index adjusted for inflation and average inflation-adjusted earnings over the past 12 months. We measure age distribution using the ratio of the middle-age cohort, age 40–49, to the old-age cohort, age 60–69. We call this the M/O ratio.
We prefer our M/O ratio to the M/Y ratio of middle-age to young adults, age 20–29, studied by Geanakoplos et al. (2004). In our view, the saving and investment behavior of the old-age cohort is more relevant for asset prices than the behavior of young adults. Equity accumulation by young adults is low. To the extent they save, it is primarily for housing rather than for investment in the stock market. In contrast, individuals age 60–69 may shift their portfolios as their financial needs and attitudes toward risk change. Eligibility for Social Security pensions is also likely to play a first-order role in determining the life-cycle patterns of saving, especially for old-age individuals.
Figure 2
Projected P/E ratio from demographic trends

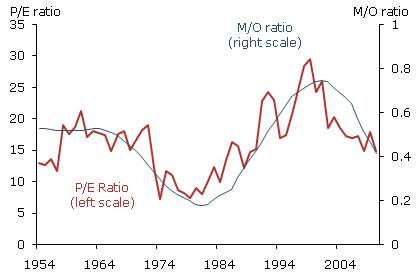
Figure 1 displays the P/E and M/O ratios from 1954 to 2010. The two series appear to be highly correlated. For example, between 1981 and 2000, as baby boomers reached their peak working and saving ages, the M/O ratio increased from about 0.18 to about 0.74. During the same period, the P/E ratio tripled from about 8 to 24. In the 2000s, as the baby boom generation started aging and the baby bust generation started to reach prime working and saving ages, the M/O and P/E ratios both declined substantially. Statistical analysis confirms this correlation. In our model, we obtain a statistically and economically significant estimate of the relationship between the P/E and M/O ratios. We estimate that the M/O ratio explains about 61% of the movements in the P/E ratio during the sample period. In other words, the M/O ratio predicts long-run trends in the P/E ratio well.
Demographic headwinds for U.S. stock prices
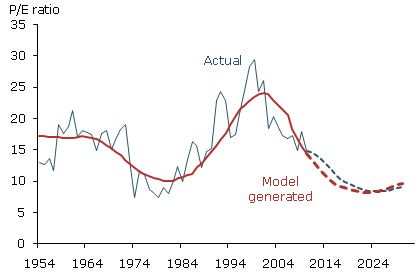
This evidence suggests that U.S. equity values are closely related to the age distribution of the population. Since demographic trends are largely predictable, we can forecast the path that the P/E ratio is likely to follow in the next few decades based on the predicted M/O ratio. Figure 2 compares the actual and model-implied P/E ratios for the sample period ending in 2010. We calculate the path for the model-implied P/E during the sample period by feeding in actual M/O ratios. We call the long-run path of the P/E ratio predicted by the model the “potential P/E ratio” and designate it P/E*. Figure 2 shows that the P/E* (red dashed line) is highly correlated with actual P/E during the sample period.
What does the model say about the future trajectory of the P/E ratio? To generate a forecast for actual P/E from 2011 to 2030, we must first project P/E* for that period. To obtain this future P/E* path, we calculate the projected M/O ratio from 2011 to 2030 by feeding Census Bureau projected population data into the estimated model. Figure 2 shows that P/E* should decline persistently from about 15 in 2010 to about 8.4 in 2025, before recovering to 9.14 in 2030.
We next calculate the probable path for the actual P/E ratio in the next two decades by introducing an error correction model for P/E*. The actual P/E ratio frequently deviates from the potential P/E ratio. To account for this deviation, we estimate an error-correction model in which we assume that changes in the actual P/E ratio depend on the previous year’s gap between P/E and P/E*. Using data from 1954 to 2010, we obtain a statistically and economically significant estimate of the model parameters. In technical terms, the gap has a coefficient of about –0.43, which indicates a tendency for the actual P/E ratio to converge to P/E*. This estimate implies that, when actual P/E exceeds potential P/E by 1%, the actual P/E ratio should fall by 0.43% within a year. Given the projected path for P/E* and the estimated convergence process, we find that the actual P/E ratio should decline from about 15 in 2010 to about 8.3 in 2025 before recovering to about 9 in 2030.
We are also interested in forecasting the potential path for stock prices. Since we have forecast a path for the P/E ratio, predicting stock prices is straightforward if we can project earnings, the E part of the ratio. For this purpose, we assume that, in the next decade, real earnings will grow steadily at the same average 3.42% annual rate by which they grew from 1954 to 2010. To obtain real earnings, we deflate nominal earnings by the consumer price index.
The model-generated path for real stock prices implied by demographic trends is quite bearish. Real stock prices follow a downward trend until 2021, cumulatively declining about 13% relative to 2010. The subsequent recovery is quite slow. Indeed, real stock prices are not expected to return to their 2010 level until 2027. On the brighter side, as the M/O ratio rebounds in 2025, we should expect a strong stock price recovery. By 2030, our calculations suggest that the real value of equities will be about 20% higher than in 2010.
Conclusion
Despite theoretical ambiguities, U.S. equity values have been closely related to demographic trends in the past half century. There has been a tight correlation between population dependency ratios, such as the M/O ratio, and the P/E ratio of the U.S. stock market. In the context of the impending retirement of baby boomers over the next two decades, this correlation portends poorly for equity values. Moreover, the demographic changes related to the retirement of the baby boom generation are well known. This suggests that market participants may anticipate that equities will perform poorly in the future, an expectation that can potentially depress current stock prices. In that sense, these demographic shifts may present headwinds today for the stock market’s recovery from the financial crisis.
Still, theoretical ambiguities make such projections far from certain. In considering the future trajectory of equity values, we have examined a single factor—the M/O ratio. Needless to say, many other factors may drive demand for stock. For example, researchers have correlated long swings in P/E ratios with relative volatility in bond and equity markets and long-term bond yields (e.g., Lansing 2004). In addition, foreign investor taste for U.S. assets may change. Foreign countries hold large quantities of U.S. securities, and foreign agents, such as sovereign wealth funds, may alter their mix of U.S. assets in favor of equities. China and other emerging market countries may relax capital controls, which would allow their nationals to invest in U.S. equity markets. These factors could potentially alleviate the adverse impact of U.S. demographic trends on stock markets.
References
Abel, Andrew B. 2001. “Will Bequests Attenuate the Predicted Meltdown in Stock Prices When Baby Boomers Retire?” Review of Economics and Statistics 83(4), pp. 589–595.
Abel, Andrew B. 2003. “The Effects of a Baby Boom on Stock Prices and Capital Accumulation in the Presence of Social Security.” Econometrica 71(2), pp. 551–578.
Bakshi, Gurdip S., and Zhiwu Chen. 1994. “Baby Boom, Population Aging, and Capital Markets.” The Journal of Business 67(2), pp. 165–202.
Brooks, Robin. 2002. “Asset-Market Effects of the Baby Boom and Social-Security Reform.” American Economic Association Papers and Proceedings 92(2), pp. 402–406.
Geanakoplos, John, Michael Magill, and Martine Quinzii. 2004. “Demography and the Long-Run Predictability of the Stock Market.” Brookings Papers on Economic Activity 1, pp. 241–307.
Krueger, Dirk, and Alexander Ludwig. 2007. “On the Consequences of Demographic Change for Rates of Returns to Capital, and the Distribution of Wealth and Welfare.” Journal of Monetary Economics 54, pp. 49–87.
Lansing, Kevin J. 2004. “Inflation-Induced Valuation Errors in the Stock Market.” FRBSF Economic Letter 2004-30 (October 29).
Obstfeld, Maurice, and Kenneth Rogoff. 2001. “The Six Major Puzzles in International Macroeconomics: Is There a Common Cause?” In NBER Macroeconomics Annual 2000, eds. Ben Bernanke and Kenneth Rogoff. Cambridge: NBER and MIT Press.
Poterba, James M. 2001. “Demographic Structure and Asset Returns.” Review of Economics and Statistics 83(4), pp. 565–584.
Opinions expressed in FRBSF Economic Letter do not necessarily reflect the views of the management of the Federal Reserve Bank of San Francisco or of the Board of Governors of the Federal Reserve System. This publication is edited by Anita Todd and Karen Barnes. Permission to reprint portions of articles or whole articles must be obtained in writing. Please send editorial comments and requests for reprint permission to research.library@sf.frb.org
