
At the end of 2015, many forecasters, including some Fed policymakers, projected four hikes in the federal funds rate in 2016. Instead, there have been no increases so far this year. While this shift in Fed policy has puzzled some observers, such a course correction is not unusual from a historical perspective. In addition, given recent changes in economic conditions, the reduced federal funds rate path this year is completely consistent with past Fed behavior.
Last December, monetary policy analysts inside and outside the Fed expected several increases in short-term interest rates this year. Indeed, the median federal funds rate projection in December 2015 by Federal Open Market Committee (FOMC) participants was consistent with four ¼ percentage point hikes in 2016. So far, none of those increases has taken place.
Of course, monetary policy decisions are often described as data-dependent, so as economic conditions change, FOMC projections for the appropriate path of monetary policy adjusts in response. However, as Rudebusch and Williams (2008) note, changes in forward policy guidance can confound observers and whipsaw investors. In fact, some have complained that the lower path for the funds rate this year represents an inexplicable deviation from past policy norms. A reporter described these complaints to Federal Reserve Chair Janet Yellen at the most recent FOMC press conference (Board of Governors 2016b): “Madam Chair, critics of the Federal Reserve have said that you look for any excuse not to hike, that the goalpost constantly moves.” Such critics have accused the Fed of reacting to transitory, episodic factors, such as financial market volatility, in a manner very different from past systematic Fed policy responses to underlying economic fundamentals.
This Economic Letter examines whether the recent revision to the FOMC’s projection of appropriate monetary policy in 2016 can be viewed as a reasonable course correction consistent with past FOMC behavior. We first show that the projected funds rate revision is not large relative to historical forecast errors. Next, we show that a simple interest rate rule that summarizes past Fed policy can account for this year’s revision to the funds rate projection based on recent changes to the FOMC’s assessment of economic conditions.
Recent revisions to FOMC economic projections
Four times a year, the FOMC releases a Summary of Economic Projections (SEP), which presents participants’ forecasts for key economic variables at various horizons. These projections get revised over time as economic conditions evolve. Table 1 presents the median projections from the December 2015 and September 2016 SEP releases (Board of Governors 2015 and 2016a). The top part of the table reports forecasts for the 2016 values of the federal funds rate, real GDP growth, the unemployment rate, headline inflation, and core inflation, which excludes energy and food prices. The bottom part of the table reports the FOMC’s longer-run economic projections, which describe where the economy is expected to settle after five or so years assuming appropriate monetary policy and the absence of further economic shocks. Much recent commentary has reassessed and debated the “new normal” for the economy, and these longer-run projections provide insight into the FOMC participants’ evolving views on this issue (Leduc and Rudebusch 2014).
Table 1
FOMC projections for 2016 and the longer run
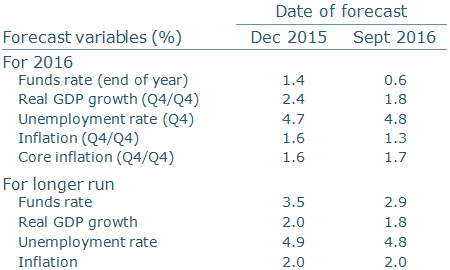
The first line of Table 1 is the focus of our analysis. The projected funds rate at the end of 2016 was revised down from 1.4% to 0.6%—a reduction of 0.8 percentage point. This revision in the policy path was accompanied by other changes in economic conditions. For example, since the end of last year, the median FOMC projection has been revised to show slower real GDP growth in 2016 and a bit higher unemployment, as the economy slightly underperformed expectations. At the same time, while core inflation for this year is expected to be a bit higher now than it was last December, overall price inflation was revised down with lower energy prices.
These economic projections have to be evaluated relative to assessments of the longer-run “normal,” which are also subject to revision. Of course, the benchmark for inflation hasn’t changed, as the FOMC’s longer-run inflation target has remained at 2%. But the September 2016 SEP revised the normal or trend growth rate of the economy lower, in part because of continuing weak productivity (Fernald 2016). Also, the projected normal or natural unemployment rate was revised down by 0.1 percentage point to 4.8% with news of greater labor force participation. Finally, there is a notable drop in the longer-run normal funds rate from 3.5% to 2.9%. Since longer-run inflation is fixed at 2%, this decline translates one-for-one into a lower inflation-adjusted or real normal funds rate. This longer-run neutral or equilibrium real interest rate—often referred to as r-star—is the risk-free short-term interest rate adjusted for inflation that would prevail in normal times with full employment. A range of factors appear to have pushed down FOMC participants’ assessments of the neutral real interest rate including a greater global supply of saving, changing demographics, and slower trend productivity growth (Williams 2016).
Is the revision to the policy projection unusually large?
In recent years, Fed policymakers have repeatedly indicated that monetary policy is data-dependent, so funds rate projections will change with new information about the economy. As Fed Chair Yellen (2016) put it, “Of course, our decisions always depend on the degree to which incoming data continues to confirm the Committee’s outlook. And, as ever, the economic outlook is uncertain, and so monetary policy is not on a preset course.”
To consider whether the revision to the FOMC’s projected policy path was outsized, Figure 1 provides historical perspective with a fan chart for the funds rate, a type of graph that many central banks use to communicate policy uncertainty. The solid black line shows the midpoint of the daily federal funds target range through the December 16, 2015, FOMC meeting, when that range was raised to ¼-½%. The blue dots represent the median projection from that meeting for end-of-year funds rate levels. For example, in December 2015, the FOMC projected the funds rate would increase 1 percentage point by the end of 2016 (middle blue dot). In contrast, the median funds rate projection from the September 2016 FOMC meeting (red dots) shows only a ¼ percentage point hike in the funds rate this year.
Figure 1
FOMC projections of end-of-year funds rate
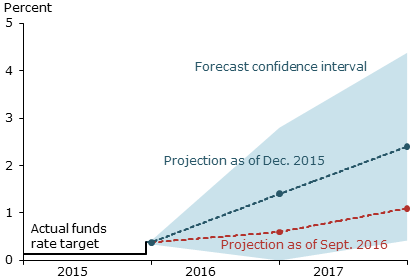
Note: Shaded region is a 70% confidence interval for the Dec. 2015 projection based on historical forecast errors.
One way to gauge whether the revision to this year’s policy path is surprisingly large is to compare it with past forecast errors. Given the December projection, the shaded fan region in Figure 1 shows an approximate 70% confidence interval of likely outcomes based on historical forecast accuracy. This range equals the median December 2015 projection plus and minus the average root mean squared prediction error for various horizons subject to a zero lower bound (Yellen 2016). The September 2016 projection is well inside this confidence interval. That is, the revision in the projected funds rate this year is not unusual from a historical standpoint. Indeed, given the distribution of past discrepancies between forecasts and outcomes, the odds were better than even that the funds rate path would be revised as much as it was in the September projection.
Is the policy revision consistent with past Fed behavior?
Can the moderately sized revision to the policy path since the end of last year be explained by changing economic circumstances? To answer this, we use a simple interest rate rule of thumb that has been widely employed to describe past systematic Fed policy reactions (see, for example, Rudebusch 2009, Carvalho and Nechio 2014, and Yellen 2016). In this policy rule, the funds rate depends on the neutral real interest rate, inflation, and the unemployment gap, which is measured as the deviation of the unemployment rate from its longer-run normal level. Such rules are often used to assess whether the level of the funds rate is appropriate. However, important policy concerns that are left out of the rule can adversely affect the validity of the rule-implied level of the funds rate as a measure of appropriate policy. Accordingly, we consider a less ambitious question, whether the revision to the 2016 policy path is consistent with the rule. This latter assessment is arguably less affected by factors that are left out of the rule but are fairly stable over time including, for example, risk management considerations regarding the lower bound on interest rates or the weak long-term inflation expectations.
Our specific benchmark policy rule recommends lowering the funds rate 1.5 percentage points if core inflation falls 1 percentage point and lowering it 2 percentage points if the unemployment gap rises 1 percentage point. Therefore, the rule-implied revision to the target funds rate depends on changes in three components:
Funds rate revision = neutral rate revision + (1.5 × inflation revision) – (2 × unemployment gap revision).
This equation can identify potential systematic determinants of a change in the FOMC’s funds rate projection. The three narrow bars on the right in Figure 2 report the contributions of the three components of the rule-implied funds rate revision. The projection of a lower longer-run normal funds rate pushes the rule-implied funds rate down by 0.6 percentage point. Thus, a lower new normal for the neutral real rate can account for much of the downward shift in the appropriate funds rate (Daly, Nechio, and Pyle 2015). A higher unemployment gap—reflecting both a slightly higher unemployment projection and slightly lower natural rate of unemployment—accounts for another 0.4 percentage point of the decline in the rule-implied rate. This effect is consistent with Chair Yellen’s message that the economy has “a little more room to run” (Board of Governors 2016b). Finally, these two factors are partly offset by marginally higher core inflation, which adds 0.15 percentage point. Similar to other research, we use core inflation in the rule to avoid overreacting to transitory food and energy price fluctuations. In addition, we use a rule without policy gradualism following Rudebusch (2006).
Figure 2
Revisions in FOMC and rule-implied 2016 funds rate:
Change from December 2015 to September 2016
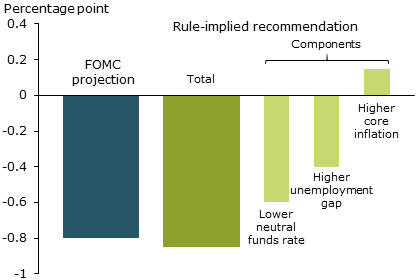
Figure 2 compares the total of these three components with the FOMC forecast revision for the 2016 federal funds rate. The left-hand bar represents the 0.8 percentage point decline in the median FOMC funds rate projection from the end of last year to September. The second bar from the left reports a total rule-implied funds rate reduction of 0.85 percentage point over that same period. The similar levels of the two wide bars show that the revision in FOMC participants’ views about appropriate policy in 2016 was consistent with a standard benchmark formulation of how the Fed reacts to changes in economic circumstances.
Conclusion
The downward shift to the FOMC’s 2016 funds rate projection was not large by historical standards and appears consistent with past Fed policy behavior in response to evolving economic fundamentals. Therefore, if monetary policy was correctly calibrated at the end of last year, it likely remains so, and the Fed has not fallen behind the curve this year.
Fernanda Nechio is a senior economist in the Economic Research Department of the Federal Reserve Bank of San Francisco.
Glenn D. Rudebusch is director of research and executive vice president in the Economic Research Department of the Federal Reserve Bank of San Francisco.
References
Board of Governors of the Federal Reserve System. 2015. “Summary of Economic Projections.” December 16.
Board of Governors of the Federal Reserve System. 2016a. “Summary of Economic Projections.” September 21.
Board of Governors of the Federal Reserve System. 2016b. “Transcript of Chair Yellen’s Press Conference,” September 21.
Carvalho, Carlos, and Fernanda Nechio. 2014. “Do People Understand Monetary Policy?” Journal of Monetary Economics 66, pp. 108–123.
Daly, Mary C., Fernanda Nechio, and Benjamin Pyle. 2015. “Finding Normal: Natural Rates and Policy Prescriptions.” FRBSF Economic Letter 2015-22 (July 6).
Fernald, John. 2016. “What Is the New Normal for U.S. Growth?” FRBSF Economic Letter 2016-30 (October 11).
Leduc, Sylvain, and Glenn D. Rudebusch. 2014. “Does Slower Growth Imply Lower Interest Rates?” FRBSF Economic Letter 2014-33 (November 10).
Rudebusch, Glenn D. 2006. “Monetary Policy Inertia: Fact or Fiction?” International Journal of Central Banking 2(4, December), pp. 85–135.
Rudebusch, Glenn D. 2009. “The Fed’s Monetary Policy Response to the Current Crisis.” FRBSF Economic Letter 2009-17 (May 22).
Rudebusch, Glenn D., and John C. Williams. 2008. “Revealing the Secrets of the Temple: The Value of Publishing Central Bank Interest Rate Projections.” In Asset Prices and Monetary Policy, ed. J.Y. Campbell. Chicago: University of Chicago Press and NBER, pp. 247–289.
Williams, John C. 2016. “Monetary Policy in a Low R-star World.” FRBSF Economic Letter 2016-23 (August 15).
Yellen, Janet L. 2016. “The Federal Reserve’s Monetary Policy Toolkit: Past, Present, and Future.” Presented at “Designing Resilient Monetary Policy Frameworks for the Future,” a symposium sponsored by the Federal Reserve Bank of Kansas City, Jackson Hole, Wyoming, August 26.
Opinions expressed in FRBSF Economic Letter do not necessarily reflect the views of the management of the Federal Reserve Bank of San Francisco or of the Board of Governors of the Federal Reserve System. This publication is edited by Anita Todd and Karen Barnes. Permission to reprint portions of articles or whole articles must be obtained in writing. Please send editorial comments and requests for reprint permission to research.library@sf.frb.org