
Investors’ demand for safe assets tends to increase when there’s more uncertainty, as in recessions. Consistent with this idea, short-term movements in the natural rate of interest, or r-star, are negatively correlated with an index of macroeconomic uncertainty. This relationship may be relevant for assessing monetary policy. An estimated policy rule that incorporates both r-star and the uncertainty index can largely reproduce the path of the federal funds rate since 1988, except during periods when policy was constrained by the zero lower bound.
The “natural” rate of interest, or r-star (r*), is the inflation-adjusted, short-term interest rate that is consistent with full use of economic resources and steady inflation near the Fed’s target level. R-star is an important benchmark for monetary policy because it determines the real interest rate that policymakers should aim for once temporary shocks to the economy have dissipated and the Fed’s macroeconomic goals have been achieved.
Most empirical estimates of r-star show a declining trend over the past several decades with current values hovering around zero (Williams 2017). While most theories suggest the decline in r-star involves longer-term slow-moving forces, it’s possible to gain some insight by examining shorter-term movements, say over four quarters. This Economic Letter shows that short-term movements in an estimate of r-star generally move in the opposite direction as an index of macroeconomic uncertainty.
This negative correlation is consistent with the idea that investors seeking a safe haven bid up the prices of safe assets, like U.S. Treasury securities, during periods of higher uncertainty, such as recessions or crises, thereby lowering the real rates of return on these assets.
In assessing the appropriate path of the federal funds rate, monetary policymakers must take into account a wide range of economic data, including estimates of r-star. Public communications about monetary policy often acknowledge the existence of uncertainty about future economic developments. To capture these ideas, I construct an estimated monetary policy rule that includes a response to both r-star and the uncertainty index. The rule can largely reproduce the actual path of the U.S. federal funds rate since 1988, except for periods when monetary policy was constrained by the zero lower bound.
Empirical estimates of r-star and long-run trends
Starting with a view of longer-run trends, Figure 1 plots the inflation-adjusted or “real” federal funds rate, computed as the nominal federal funds rate minus the trailing four-quarter core personal consumption expenditures (PCE) inflation rate. Core inflation tends to be a better predictor of future inflation because it removes the volatile food and energy components. Figure 1 also plots the two-sided r-star series estimated by Laubach and Williams (2016, updated). Both of these real rates exhibit downward-sloping trends—a pattern that is consistent with declines in global real interest rates observed over the same period (Rachel and Smith 2015).
Figure 1
Real interest rates and potential GDP growth
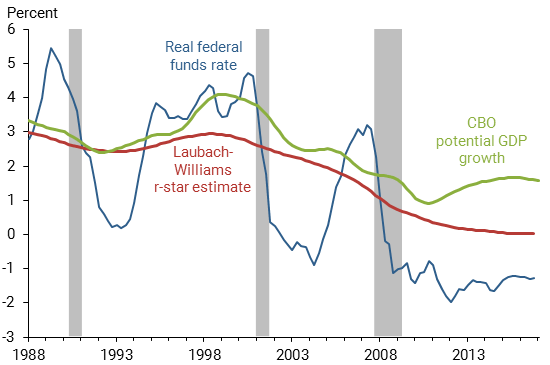
Note: Shaded areas indicate NBER recession dates.
Standard economic models imply that r-star is linked to households’ degree of patience, which influences their willingness to save, and to the expected growth rate of potential GDP, which influences the rate of return from saving. Over the past three decades, empirical estimates of r-star tend to mimic general movements in the four-quarter growth rate of potential GDP (green line), as estimated by the Congressional Budget Office (Lansing 2016). Theories that seek to explain these trends include (1) the demographics of an aging labor force with sluggish population growth, (2) the slowing of technology-driven productivity growth, (3) a global savings glut, and (4) a rise in the demand for safe assets relative to the available supply. All of these forces would be expected to put downward pressure on r-star.
Short-run movements in r-star and uncertainty
Now turning to short-run movements, Figure 2 compares the four-quarter change in the Laubach-Williams estimate of r-star with an index of macroeconomic uncertainty constructed by Jurado, Ludvigson, and Ng (2015). The uncertainty index summarizes how difficult it is to forecast the near-term path of 132 separate macroeconomic variables using a joint statistical model of the U.S. economy. Specifically, the index is constructed from the model’s three-month-ahead forecast errors. Higher values of the index indicate that the model’s forecast errors have grown.
Figure 2
Movements in r-star and macroeconomic uncertainty
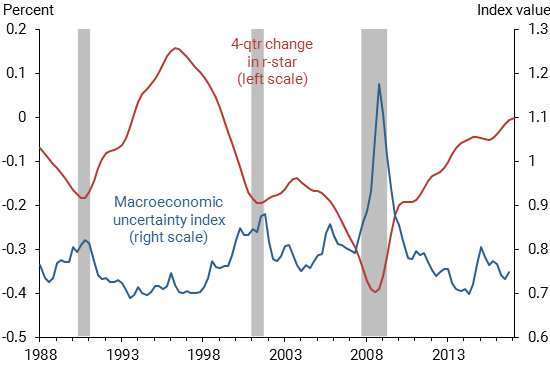
Note: Shaded areas indicate NBER recession dates. Macroeconomic uncertainty is the quarterly average of the three-month-ahead index by Jurado et al. (2015).
As the economy heads into a recession, the uncertainty index starts rising, while the four-quarter change in r-star becomes more negative—indicating that r-star is falling more rapidly. When the recession is over, uncertainty declines while the four-quarter change in r-star becomes more positive or less negative. The four-quarter movements in r-star are quantitatively small but detectable. The correlation coefficient between the two series is strongly negative, confirming the inverse relationship.
During recessions or crises, the prices of risky assets like stocks tend to fall while prices of safe assets like Treasury securities tend to rise. These movements reflect investors’ flight to safety as they shift their portfolios away from risky assets to avoid short-term losses. A rise in the price of a Treasury security translates into a decline in its nominal yield and, because inflation is sluggish, a decline in its real rate of return. Real rates and r-star tend to decline during recessions when uncertainty rises. The strong negative correlation between the two series in Figure 2 is consistent with the idea that shifts in the demand for safe assets are an important driving force for short-term movements in r-star. Taking a broader perspective, if shifts in the demand for safe assets drive short-term movements in r-star, then perhaps the decades-long decline in r-star for the United States and other advanced countries is being driven by a longer-term trend in which the global demand for safe assets is outpacing the available supply. Economic research finds support for this idea (Golec and Perotti 2017).
Do movements in r-star and uncertainty influence monetary policy?
The Fed’s goals are to keep inflation low while promoting sustainable growth and full employment. Policymaker behavior is often modeled as a Taylor rule, whereby a short-term nominal interest rate (the federal funds rate) is adjusted in response to inflation and some measure of real economic activity (Taylor 1999). It is interesting to consider whether a Taylor rule that includes a response to both r-star and the macroeconomic uncertainty index can improve the fit of the actual federal funds rate path.
As part of the Federal Open Market Committee’s Summary of Economic Projections (SEP), meeting participants provide their views on the projected paths of real GDP growth, the unemployment rate, inflation, and the nominal federal funds rate over the next three calendar years and in the longer run. Since r-star is a longer-run concept, we can infer the median SEP projection for r-star by subtracting the median longer-run projection for inflation from the median longer-run projection for the nominal federal funds rate. The median SEP projection for r-star computed this way has ratcheted down over time, as documented by Lansing (2016), and currently stands at 1%. Given this background, one might expect that shifts in empirical estimates of r-star could help explain movements in the federal funds rate.
A study by Evans et al. (2015) finds that concepts involving “uncertainty” and “insurance” were cited in a number of Federal Reserve public communications from 1987 to 2008 to justify monetary policy decisions. The same study finds that the Jurado-Ludvigson-Ng macroeconomic uncertainty index is statistically significant in Fed policy rule regressions, with higher values of the index implying lower values of the federal funds rate. The authors summarize this evidence as describing the Fed’s “risk management approach to monetary policy.”
To examine the possible joint influence of r-star and uncertainty on monetary policy, I estimate three versions of a policy rule using data from 1988 through the end of 2008. The first version regresses the federal funds rate on a constant, the four-quarter core PCE inflation rate, the CBO output gap, and the four-quarter growth rate of real GDP, a specification that is similar to some previous studies (Coibion and Gorodnichenko 2011). These explanatory variables, plotted in Figure 3, are each lagged by one quarter in the regression equation to help account for real-time data availability issues. The first version of the policy rule implicitly assumes that r-star remains constant over the 21-year data sample. The second version accounts for movements in r-star by adding the lagged value of the Laubach-Williams (LW) two-sided estimate of r-star as an additional explanatory variable. The third version goes one step further by adding the lagged value of the macroeconomic uncertainty index.
Figure 3
Three explantory variables in Taylor rule
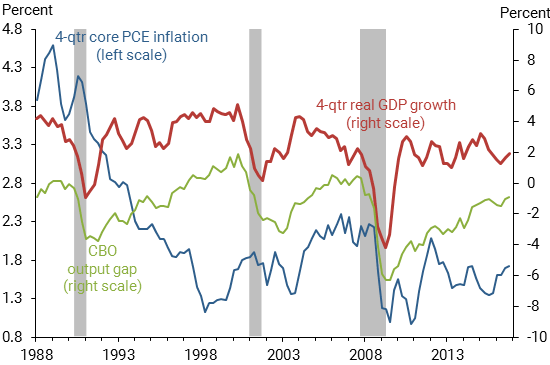
Note: Shaded areas indicate NBER recession dates.
Figure 4 plots the fitted values of the federal funds rate from each version of the estimated policy rule. The red line shows that the third version provides the best in-sample fit with the fitted federal funds rate, accounting for more than 90% of the variance of the actual federal funds rate (blue line) from 1988 to 2008. The other two versions account for somewhat less of the variance, but their fit is still good. All of the explanatory variables in the third version of the policy rule are statistically significant. The estimated coefficient on r-star is positive while the estimated coefficient on the uncertainty index is negative, consistent with economic intuition and the fact that these two variables move in opposite directions (Figure 2).
Figure 4
Fitted and projected federal funds rates
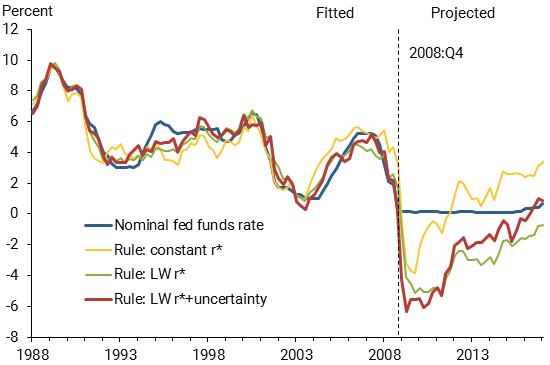
We can use the same estimated policy rules to compute projected paths for the federal funds rate from 2009 on. All three versions imply projected paths that dip into negative territory. This result indicates that the zero lower bound on the federal funds rate prevented the Fed from responding to economic variables in the same way that it had before 2009. An alternative interpretation is that the Fed’s large-scale asset purchase programs served as an effective substitute for the negative desired federal funds rate, thus mitigating the impact of the zero lower bound on the economy (Wu and Zhang 2016).
The third version of the policy rule does a reasonably good job of matching recent movements in the federal funds rate. Specifically, it predicts liftoff of the quarterly average funds rate from near zero in the third quarter of 2016, which is close to the actual liftoff that occurred between the fourth quarter of 2015 and the first quarter of 2016.
Moreover, the third version predicts a quarterly average funds rate of 88 basis points in the first quarter of 2017—very close to the actual value of 70 basis points.
Conclusion
Short-run movements in r-star and an index of macroeconomic uncertainty are negatively correlated, suggesting that investors’ demand for safe assets is a key driving force for movements in r-star. Monetary policy decisions are influenced by many factors, including estimates of r-star and the degree of uncertainty that exists about future economic conditions. If uncertainty remains low or declines further as the U.S. economic expansion continues, then estimates of r-star are likely to gradually increase. Based on past Fed behavior, such a scenario, if realized, would be consistent with a gradually rising path for the federal funds rate.
Kevin J. Lansing is a research advisor in the Economic Research Department of the Federal Reserve Bank of San Francisco.
References
Coibion, Olivier, and Yuriy Gorodnichenko. 2011. “Monetary Policy, Trend Inflation, and the Great Moderation: An Alternative Interpretation.” American Economic Review 101, pp. 341–370.
Evans, Charles, Jonas Fisher, Francois Gourio, and Spencer Krane. 2015. “Risk Management for Monetary Policy Near the Zero Lower Bound.” Brookings Papers on Economic Activity (Spring), pp. 141–196.
Golec, Pascal, and Enrico Perotti. 2017. “Safe Assets: A Review.” European Central Bank Working Paper 2035 (March).
Lansing, Kevin J. 2016. “Projecting the Long-Run Natural Rate of Interest.” FRBSF Economic Letter 2016-25 (August 29).
Laubach, Thomas, and John C. Williams. 2016. “Measuring the Natural Rate of Interest Redux.” Business Economics 51, pp. 257–267.
Jurado, Kyle, Sydney C. Ludvigson, and Serena Ng. 2015. “Measuring Uncertainty.” American Economic Review 105(3), pp. 1,177–1,216.
Rachel, Lukasz, and Thomas D. Smith. 2015. “Secular Drivers of the Global Real Interest Rate.” Bank of England, Staff Working Paper 571.
Taylor, John B. 1999. “A Historical Analysis of Monetary Policy Rules.” In Monetary Policy Rules, ed. J.B. Taylor. Chicago: University of Chicago Press, pp. 319–348.
Williams, John C. 2017. “Three Questions on R-star.” FRBSF Economic Letter 2017-05 (February 21).
Wu, Jing Cynthia, and Ji Zhang. 2016. “A Shadow Rate New Keynesian Model.” NBER Working Paper 22856.
Opinions expressed in FRBSF Economic Letter do not necessarily reflect the views of the management of the Federal Reserve Bank of San Francisco or of the Board of Governors of the Federal Reserve System. This publication is edited by Anita Todd and Karen Barnes. Permission to reprint portions of articles or whole articles must be obtained in writing. Please send editorial comments and requests for reprint permission to research.library@sf.frb.org