

Although the labor market has steadily strengthened, wage growth has remained slow in recent years. This raises the question of whether the wage Phillips curve—the traditional relationship between labor market slack and wage growth—has weakened. Estimating a causal link from slack to wage growth using national data is difficult. However, using city-level data over the past 25 years shows that the cross-city relationship has weakened since the Great Recession. Explanations consistent with this timing suggest that the Phillips curve may return to a steeper curve in the future.
One puzzling fact in recent years is that wage growth has remained subdued while the unemployment rate has fully recovered from the Great Recession (see Federal Open Market Committee 2017). A traditional textbook theory by A.W. Phillips (1958) explains that labor market strengthening pushes up wage growth, a relationship that is known as the wage Phillips curve. Hence, the recent U.S. experience has caused many researchers to reconsider the strength of this historical relationship.
In this Economic Letter, we use city-level data to examine whether the sensitivity of wage growth to labor market tightness or slack has changed over time. Between 1991 and 2015, we find a clear negative relationship on average between wage growth and labor market slack across cities, meaning declining slack tends to push up wage growth. However, we uncover a significant weakening of the direct effect of slack on wage growth since 2009, suggesting a flattening of the wage Phillips curve. There are many potential explanations for this weaker relationship, but its timing suggests cyclical factors may play a role, and thus that the recent flattening of the wage Phillips curve may be short-lived.
Correlations between wage growth and the unemployment rate
One way to study the link between the labor market and wage growth is to focus on the aggregate level. However, this approach can be problematic because other important macroeconomic factors that are hard to measure affect national wage growth and slack over time. For example, global oil price shocks such as those in the 1970s can boost inflation and overall business costs, leading to higher unemployment.
To avoid this complication, researchers have increasingly turned to city- and state-level data to examine the effect of slack on wage growth. These data can be useful because such studies hold national and global factors fixed when comparing wage growth and slack across places in the United States. Also, wage growth and unemployment conditions often vary substantially across areas. All of that variation is useful for statistically estimating the average relationship between the two. For example, Smith (2014) uses state data to find that wage growth tends to move in the opposite direction as labor market slack; similarly, Fitzgerald and Nicolini (2014) find a stable negative relationship using city-level data.
We follow a similar approach to these studies, but we examine more recent data from the recovery and whether the relationship has changed in recent years. We measure wage growth against the unemployment rate for 27 metropolitan statistical areas (MSAs) each year from 1991 to 2015. We measure city-level wage growth using the annual percentage change in annual wage and salary income per worker for that city/MSA from the Bureau of Economic Analysis.
Figure 1
City-level relationship between wage growth, unemployment
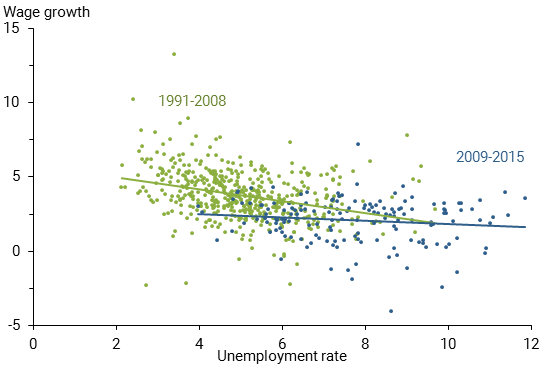
Note: Annual data by MSA. Two unemployment rate outliers, one each from 2009 and 2010, are not shown.
In Figure 1, we split the observations between pre- and post-recession periods—1991 to 2008 (green dots) and 2009 to 2015 (blue dots). An estimate of the linear relationship based on a statistical method known as an ordinary least squares regression for each period is shown by solid lines. During the 1991–2008 period there is a clear negative and statistically significant relationship between wage growth and the unemployment rate. However, the correlation in the 2009–2015 period is close to zero, shown by the nearly horizontal line. This pattern suggests that the wage Phillips curve may have flattened recently—that is, falling unemployment has not signaled faster wage growth during these years.
Has the cross-city wage Phillips curve flattened?
These simple correlations do not account for a number of factors that could be correlated with the local unemployment rate and also independently affect wage growth. Hence, they may not reflect the causal link from labor market slack to wage growth. Prior theoretical work on the underpinnings of the wage Phillips curve provides guidance on how best to estimate this causal relationship.
There are three main factors that need to be accounted for. First, because the “natural” rate of unemployment—the rate consistent with a labor market in equilibrium—can vary over time and across areas, a better measure of labor market slack than the unemployment rate is the difference between the actual unemployment rate and the natural rate, which is known as the unemployment gap. The natural rate of unemployment captures differences in unemployment across places and over time due to the composition of the workforce or institutional changes such as adjustments to state unemployment insurance. We measure the natural rate of unemployment for a city and year using a simple 10-year trailing average of the city’s actual unemployment rate.
Second, inflation expectations are likely to affect workers’ demands for wage increases and what employers are willing to pay. Some elements of inflation expectations, such as the Federal Open Market Committee’s target inflation rate, will affect all cities equally and hence are held constant when estimating the Phillips curve based on cross-city comparisons. We account for any remaining city-specific inflation expectations using data on cities’ actual inflation rates over the previous year.
Third, labor productivity growth should affect wage growth and can also affect the unemployment gap. We assume that productivity growth varies both over time due to national factors like technological change, and over cities due to time-invariant factors like industry composition. Our estimation allows for such time-invariant factors by using a different constant term for each city.
We estimate a cross-city wage Phillips curve regression using city-level data on wage growth, the unemployment gap, and lagged inflation. We first estimate this wage Phillips curve specification over the full sample period, 1991 to 2015, and find a slope of –0.35, which is statistically significant at the 1% level. This slope implies that a 1 percentage point increase in a city’s unemployment gap is associated with a decline in its wage inflation rate of 0.35 percentage point.
However, these full sample results mask considerable variations across subperiods. For instance, the estimated cross-city wage Phillips curve slope is –0.45 over 1991–2008, but falls to just –0.14, and not statistically different from zero, over 2009–2015. The difference between these slope estimates is statistically significant. Using an alternative regression specification, we also estimated a separate short- and long-run slope for each period, which accounts for the possibility that wage growth responds with a lag to slack. Both the short- and long-run slopes are significantly closer to zero in the later period than in the earlier period.
We then trace out more generally the change over time in the cross-city wage Phillips curve slope using seven-year “rolling-sample” regressions. Specifically, we first estimate the Phillips curve as described above for the seven-year city-level data set covering 1991 to 1997. We then estimate it using the seven-year data set covering 1992 to 1998. We continue this process through the latest seven-year data set, covering 2009 to 2015. From each regression, we collect the estimated Phillips curve slope coefficient and its 90% confidence interval, which indicates the degree of statistical precision with which we are able to estimate that slope. The resulting slope coefficients and confidence intervals in Figure 2 show a steady flattening of the cross-city wage Phillips curve slope starting with the 2001–2007 sample and continuing through the latest 2009–2015 sample.
Figure 2
Flattening of the cross-city wage Phillips curve slope
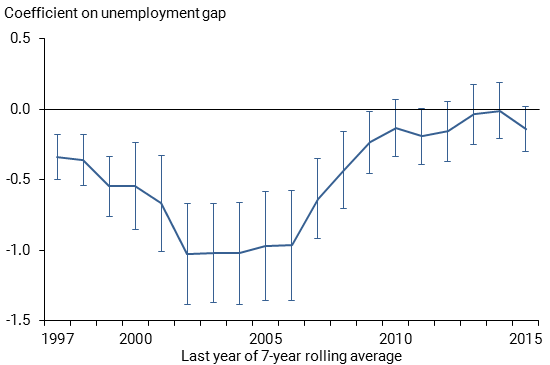
Note: Annual data by MSA. Coefficients and 90% confidence interval on unemployment gap from a regression of wage inflation on the unemployment gap and on lagged price inflation for the preceding seven years.
What can we infer about the aggregate wage Phillips curve?
The causal link from slack to wage growth is difficult to persuasively estimate using aggregate time series data both because of a limited number of observations and because there can be important unobserved aggregate factors that affect slack and wage growth simultaneously. Hence, the cross-city evidence can be informative regarding whether the true unobserved national Phillips curve slope also has flattened over time.
It is possible that the cross-city relationship could have flattened over time without a similar result for the aggregate if labor mobility had increased across cities. Blanchard and Katz (1992) document that interstate migration is a key way U.S. state economies return to equilibrium after local booms and busts. In effect, job seekers migrating to a city in response to a local boom represent a labor supply shock that helps offset the wage pressures stemming from the initial increase in labor demand. This tends to mute the effect of labor market tightness on wage inflation relative to the national level, where workers entering the workforce from foreign countries is much more limited.
So has labor mobility within the United States increased over recent years? Recent work by Kaplan and Schulhofer-Wohl (2017) find the opposite, that interstate migration rates have fallen over the past 20 years. This suggests that the aggregate Phillips curve is likely to have flattened at least as much as the cross-geographical Phillips curve.
What’s ahead for the wage Phillips curve?
City-level regressions are useful for providing a more accurate estimate of the causal relationship between labor market tightness and wages. Therefore, theories that are consistent with a flattening Phillips curve must involve fundamental changes in how local wages are set in response to local labor market tightness. For example, a decline in worker bargaining power could reduce their ability to negotiate higher wages when the labor market is tight. This would be consistent with the rising industry concentration ratios and decline in the labor share documented by Autor et al. (2017). If the recent change in the curve is due to such secular trends in worker bargaining power, the flattening is not likely to reverse in the near future.
However, many of those trends started before the Phillips curve began to flatten, according to our estimates. Another possibility suggested in Daly, Hobijn, and Pedtke (2017) that is better aligned with this timing has to do with the effect of labor market slack on the composition of the workforce, which in turn affects measured wage growth. Daly et al. highlight the compositional shift toward lower-wage workers during the recovery from the Great Recession as those workers reentered the labor force, thus holding down the growth in average wages. This compositional drag on wage growth would be expected to move in the same direction as labor slack across cities, leading to a flatter Phillips curve. According to this explanation, the wage Phillips curve should steepen in coming years as this cyclical composition effect dissipates. Thus, monitoring how the cross-geographical curve evolves should help reveal the underlying causes of the recent flattening, thereby helping policymakers better understand the causal mechanisms underlying the wage Phillips curve.
Sylvain Leduc is a Deputy Governor of the Bank of Canada.
Daniel J. Wilson is a research advisor in the Economic Research Department of the Federal Reserve Bank of San Francisco.
References
Autor, David, David Dorn, Lawrence F. Katz, Christina Patterson, and John Van Reenen. 2017. “Concentrating on the Fall of the Labor Share.” American Economic Review 107(5), pp. 180–185.
Blanchard, Olivier, and Lawrence Katz. 1992. “Regional Evolutions.” Brookings Papers on Economic Activity, pp. 1–75.
Daly, Mary C., Bart Hobijn, and Joseph Pedtke. 2017. “The Good News on Wage Growth.” FRB San Francisco, SF Fed Blog, August 14.
Federal Open Market Committee. 2017. “Minutes of the Federal Open Market Committee,” July 25–26.
Fitzgerald, Terry J., and Juan Pablo Nicolini. 2014. “Is There a Stable Relationship between Unemployment and Future Inflation? Evidence from U.S. Cities.” FRB Minneapolis Working Paper 713.
Kaplan, Greg, and Sam Schulhofer-Wohl. 2017. “Understanding the Long-Run Decline in Interstate Migration.” International Economic Review 58(1), pp. 57–94.
Phillips, A.W. 1958. “The Relation between Unemployment and the Rate of Change of Money Wage Rates in the United Kingdom, 1861–1957.” Economica 25, 1958, pp. 283–299.
Smith, Christopher L. 2014. “The Effect of Labor Slack on Wages: Evidence from State-level Relationships.” Federal Reserve Board of Governors, FEDS Notes, June 2.
Opinions expressed in FRBSF Economic Letter do not necessarily reflect the views of the management of the Federal Reserve Bank of San Francisco or of the Board of Governors of the Federal Reserve System. This publication is edited by Anita Todd and Karen Barnes. Permission to reprint portions of articles or whole articles must be obtained in writing. Please send editorial comments and requests for reprint permission to research.library@sf.frb.org