

The ability of the Treasury yield curve to predict future recessions has recently received a great deal of public attention. An inversion of the yield curve—when short-term interest rates are higher than long-term rates—has been a reliable predictor of recessions. The difference between ten-year and three-month Treasury rates is the most useful term spread for forecasting recessions—without any adjustment for an estimate of the underlying term premium. However, such correlations in the data do not identify cause and effect, which complicates their interpretation.
Although the U.S. economy is in a sustained expansion and many economic indicators show continued strength, concerns about a possible recession have emerged. One reason is the narrowing spread between long-term and short-term Treasury yields. A well-established regularity in postwar U.S. economic history is that an inverted yield curve—when long-term rates drop below short-term rates—is generally followed shortly afterward by an economic recession. In Bauer and Mertens (2018) we documented the strong and robust predictive power of the term spread for U.S. recessions. Part of the current debate centers around the question of which specific term spread is the appropriate one to focus on. In this Economic Letter, we systematically address the question of which term spread has been the most reliable summary measure of the shape of the yield curve when the purpose is to forecast future recessions. Another area of disagreement in this ongoing public debate is how to interpret the current flattening of the yield curve in the context of the empirical evidence on recession predictions. We discuss the implications of a narrowing term spread for economic forecasting and how much concern is warranted about the downside risks for the U.S. economy.
Many different term spreads
A term spread is the difference between a long-term and a short-term interest rate. It measures the steepness of the yield curve, the graph of interest rates across all available maturities, with a positive term spread corresponding to an upward sloping yield curve. Financial commentators typically focus on the difference between the ten-year and two-year Treasury yield (10y–2y), because the former summarizes long-term perceptions and sentiment of bond market investors, while the latter is viewed as a reasonable indicator of the stance of monetary policy. But many other combinations of long-term and short-term yields are possible. The tradition in the academic literature has been to focus on the spread between the ten-year and three-month Treasury yields (10y–3m), going back to Estrella and Mishkin (1998), who documented the strong predictive power of this term spread for recessions and economic activity. Recently, Engstrom and Sharpe (2018) have argued that a spread of short-term Treasury rates—the difference between the six-quarters-ahead forward rate and the three-month yield (forward6q–3m)—might be preferable as a predictor because it focuses on expectations of the near-term path of monetary policy.
Figure 1 shows the evolution of these three spreads since the year 2000, with shaded areas representing recessions. The more common “long-term” spreads moved closely together over this period, while the Engstrom-Sharpe spread exhibits somewhat more idiosyncratic movements, particularly during the period from 2009 to 2015 when short-term interest rates were constrained by the zero lower bound. Over a longer history going back to the 1970s, these three term spreads generally behaved quite similarly. All three typically drop below zero, indicating an inversion of the yield curve, about a year or two before the onset of a recession. Most recently, the long-term spreads have both continued their decline, though the 10y–2y spread has gotten notably closer to the critical threshold of zero below which the yield curve would be inverted, while the 10y–3m spread is at a more comfortable level at slightly below 1% (data through end of July). The short-term spread, by contrast, has increased over the past year, a fact from which Engstrom and Sharpe derive comfort in terms of lower recession risk.
Figure 1
Recent evolution of different term spreads
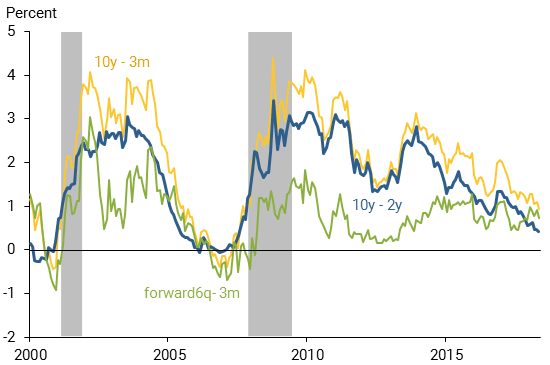
Note: Treasury yield spreads shown are for 10-year minus 3-month (10y–3m), 10-year minus 2-year (10y–2y), and 6-quarters-ahead forward minus 3-month (forward6q–3m) maturities. Data are monthly from January 2000 through July 2018.
A more formal investigation of forecast accuracy can assess the relative reliability of the various predictors and how worrisome the recent readings in Figure 1 should be. Using monthly data from January 1972 to July 2018, we predict whether the economy is in recession 12 months in the future, using only the value of a specific spread. This forecasting rule parallels the one in our previous Economic Letter (Bauer and Mertens 2018) and in many published studies. Without having to estimate a statistical model, we can measure the accuracy of this rule using the so-called area under the curve (AUC). This measure originated in the medical testing literature and roughly captures the probability of correct prediction, with 0.5 corresponding to the absence of any predictive power (corresponding to a coin toss) and 1.0 to perfect prediction.
Figure 2 reports the AUC for the three spreads mentioned above, as well as for the difference between the ten-year and one-year Treasury yields (10y–1y) that we focused on in our previous Letter and one other “adjusted” spread measure that accounts for the term premium, which we will discuss below. The three long-term spreads and the one short-term spread all have very similar predictive accuracy, with AUCs of 0.85 to 0.89. The traditional 10y–3m spread performs better than the other three spreads by a slight margin. We also assess our predictors over a sample period that excludes the so-called zero-lower-bound period, when short-term interest rates were essentially zero (2009–2015) to give the best possible chance to the short-term spread, as did Engstrom and Sharpe. This helps its relative performance and puts it about on par with the 10y–3m spread. Engstrom and Sharpe found that their short-term spread statistically dominated the 10y–2y spread, and our findings are consistent with this result. However, we also show that the traditional 10y–3m spread is the most reliable predictor, and we do not find any evidence that would support discarding this long-standing benchmark as a measure of the shape of the yield curve. It is worth emphasizing again, however, that all of these term spreads are fairly accurate predictors and quite informative about future recession risk; the differences in forecasting accuracy are small.
Figure 2
Predictive power of different term spreads
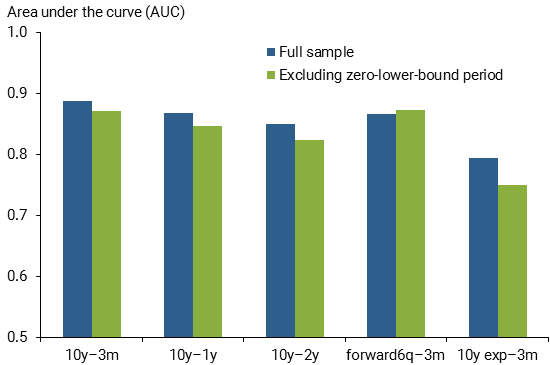
Note: Treasury yield spreads shown are for the 10-year minus 3-month (10y– 3m), 10-year minus 1-year (10y–1y), 10-year minus 2-year (10y–2y), 6-quarters- ahead forward minus 3-month (forward6q–3m), and 10-year expectations minus 3-month (10y exp–3m) maturities.
Whether to adjust for the term premium
Changing risk appetite and investor sentiment affect long-term interest rates, and one may wonder whether our term spread should be corrected for these influences. On theoretical grounds, one may argue that, when gauging whether the bond market signals a future downturn, one should not compare the ten-year yield itself, but instead its expectations component, the average expected path of short-term interest rates over the next ten years, to the current short-term rate.
We therefore also assess the predictive accuracy of a term spread that is adjusted using an estimate of the so-called term premium, similar to Johannson and Meldrum (2018). We subtract the term premium estimate of Adrian, Crump, and Moench (2013) to obtain the adjusted “expectations-only” term spread (10y exp–3m). Our results in Figure 2 reveal that this adjusted term spread is a less accurate predictor of recessions than the observed unadjusted term spread. Additional analysis using different term premium estimates and spread measures, including an exact replication of the results in Johannson and Meldrum (2018), confirms this finding. The term premium does not appear to have any incremental predictive power relative to current term spreads. In other words, a negative term spread signals high recession risk, regardless of whether a low term premium or low short-rate expectations are holding down long-term interest rates.
But what about quantitative easing (QE)? One might argue that long-term yields, particularly the term premium component, are significantly depressed due to QE programs by central banks around the world and the large balance sheet of the Federal Reserve. Much empirical research suggests that QE likely had quantitatively large negative effects on long-term rates and that some of these effects are still present and continue to push down the long end of the yield curve (Bonis, Ihrig, and Wei 2017). If long-term yields are still low because of QE, and if these effects contribute to the yield curve flattening but do not increase recession risk, then some part of that flattening may not be worrisome at all.
While this reasoning is plausible, these are, however, two big ifs. First, there is a lot of uncertainty around the effects of QE on interest rates, as evident from statistical measures of uncertainty, such as the wide confidence bands reported by Bonis, Ihrig, and Wei (2017) and others. In reality, the uncertainty is almost surely even larger than that, because these estimates assume a specific underlying model that is itself highly uncertain. Second, while a lower term premium contributes to easier financial conditions and therefore stimulates economic activity, this was also the case in the past and at times may have contributed to economic overheating, heightened financial stability risk, and ultimately higher recession risk. There is no clear evidence in the data that “this time is different” or that forecasters should ignore part of the current yield curve flattening because of the presumed macro-financial effects of QE.
How to interpret the predictive evidence
In light of the evidence on its predictive power for recessions, the recent evolution of the yield curve suggests that recession risk might be rising. Still, the flattening yield curve provides no sign of an impending recession. First, the evidence suggests that recession predictions based on the yield curve require an inversion (Bauer and Mertens 2018); no matter which term spread is used to measure its shape, the yield curve is not yet inverted. Second, the most reliable summary measure of the shape of the yield curve, the ten-year–three-month spread, is nearly 1 percentage point away from an inversion.
Furthermore, when interpreting the yield curve evidence, one should keep in mind the adage “correlation is not causation.” Specifically, the predictive relationship of the term spread does not tell us much about the fundamental causes of recessions or even the direction of causation. On the one hand, yield curve inversions could cause future recessions because short-term rates are elevated and tight monetary policy is slowing down the economy. On the other hand, investors’ expectations of a future economic downturn could cause strong demand for safe, long-term Treasury bonds, pushing down long-term rates and thus causing an inversion of the yield curve. Historically, the causation may well have gone both ways. Great caution is therefore warranted in interpreting the predictive evidence.
Conclusion
The yield curve has been a reliable predictor of recessions, and the best summary measure is the spread between the ten-year and three-month yields. Although this particular spread has narrowed recently like most other measures, it is still a comfortable distance from a yield curve inversion. In this Letter, we do not find an empirical basis for adjustments based on the term premium, especially in light of uncertainties about the possible effects of quantitative easing. Finally, when interpreting the yield curve evidence, it is important to remember that the predictive relationship in the data leaves open important questions about cause and effect.
Michael D. Bauer is a research advisor in the Economic Research Department of the Federal Reserve Bank of San Francisco.
Thomas M. Mertens is a research advisor in the Economic Research Department of the Federal Reserve Bank of San Francisco.
References
Adrian, Tobias, Richard K. Crump, and Emanuel Moench. 2013. “Pricing the Term Structure with Linear Regressions.” Journal of Financial Economics 110, pp. 110–138.
Bauer, Michael D., and Thomas M. Mertens. 2018. “Economic Forecasts with the Yield Curve.” FRBSF Economic Letter 2018-07 (March 5).
Bonis, Brian, Jane Ihrig, and Min Wei. 2017. “The Effect of the Federal Reserve’s Securities Holdings on Longer-term Interest Rates.” FEDS Notes, Federal Reserve Board of Governors, April 20.
Engstrom, Eric, and Steve Sharpe. 2018. “(Don’t Fear) the Yield Curve.” FEDS Notes, Federal Reserve Board of Governors, June 28.
Estrella, Arturo, and Frederic S. Mishkin. 1998. “Predicting U.S. Recessions: Financial Variables as Leading Indicators.” Review of Economics and Statistics 80(1), pp. 45–61.
Johansson, Peter, and Andrew Meldrum. 2018. “Predicting Recession Probabilities Using the Slope of the Yield Curve.” FEDS Notes, Federal Reserve Board of Governors, March 1.
Opinions expressed in FRBSF Economic Letter do not necessarily reflect the views of the management of the Federal Reserve Bank of San Francisco or of the Board of Governors of the Federal Reserve System. This publication is edited by Anita Todd and Karen Barnes. Permission to reprint portions of articles or whole articles must be obtained in writing. Please send editorial comments and requests for reprint permission to research.library@sf.frb.org