The Federal Reserve has typically used a short-term interest rate as the policy tool for achieving its macroeconomic goals. However, with short-term rates constrained near zero for much of the past decade, the Fed was impelled to use two unconventional monetary policy tools: forward guidance and quantitative easing. These tools likely strengthened the economic recovery and helped return inflation to the Fed’s target—although their full impact remains uncertain.
In recent years, the term conventional monetary policy has referred to a central bank altering a short-term interest rate to achieve its macroeconomic objectives. Specifically, in the United States, the Federal Reserve conducts conventional monetary policy by setting the federal funds rate to reach its legislated goals of full employment and low inflation. However, during the global financial crisis and Great Recession of 2007–2009, central banks around the world pushed short-term interest rates to near zero, effectively, their lower limit.
Unfortunately, given the severity of the economic downturn, even these ultralow interest rates were not enough to revive output and employment growth sufficiently. Therefore, central banks turned to additional policy tools to achieve their objectives. For the Federal Reserve, these nonstandard or unconventional monetary policy tools included forward guidance through communication about future short-term interest rates as well as the purchase of government bonds or quantitative easing. This Economic Letter briefly describes why these unconventional policy tools were adopted, what effect they likely produced, and what their future may be.
The introduction of unconventional policy
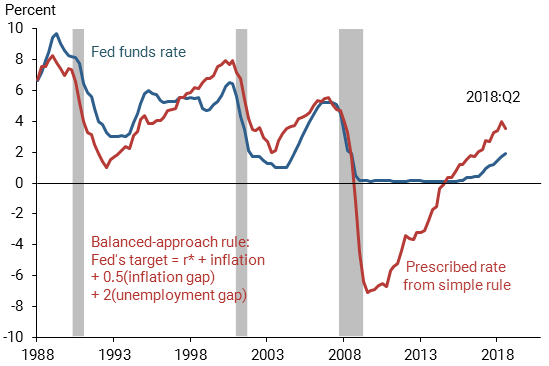
To provide some perspective on why the Fed adopted unconventional monetary policy, Figure 1 shows that the Fed reduced its policy interest rate—the federal funds rate (blue line)—about 6 percentage points for the 1990 and 2001 recessions in order to boost spending and growth. These conventional policy responses are broadly consistent with what a simple rule for setting monetary policy would have recommended given the levels of unemployment and inflation (red line). This specific policy rule recommends lowering the funds rate 1.5 percentage points if core inflation falls 1 percentage point and lowering it 2 percentage points if the unemployment rate rises 1 percentage point. The rule also accounts for a downtrend in the steady-state inflation-adjusted short rate, known as r-star (r*).
During the global financial crisis and Great Recession, the Fed again cut the funds rate a bit more than 5 percentage points. However, given the much worse economic conditions, the usual response wasn’t nearly enough. With the unemployment rate reaching 10% in 2009, the simple policy rule would have prescribed much more monetary policy stimulus—indeed, an additional 7 percentage points of interest rate cuts. The resulting large conventional monetary policy shortfall is evident in Figure 1. Unfortunately, the Fed was limited from lowering the funds rate further because of an effective lower bound on interest rates near zero.
Figure 1
Federal funds rate: Actual and policy rule recommendation
The shortfall between what the Fed could deliver with conventional policy and what seemed appropriate given the dire economic conditions prompted the Fed to employ unconventional monetary policy tools. While conventional policy employs a short-term interest rate to affect financial conditions and the economy, unconventional monetary policy uses other tools to do so. The Fed employed forward guidance and quantitative easing as these unconventional policy tools (Kuttner 2018).
The Fed’s forward guidance
After reducing short-term interest rates to near zero, the Fed sought to affect longer-term bond yields and other financial asset prices directly by providing forward guidance about future short-term interest rates. To understand this process, note that longer-term yields have two key components. The first—the expectations component—is the average of expected future short-term interest rates over the maturity of the longer-term bond. The expectations component of, say, the 10-year bond yield is the average of expected short rates over the next 10 years. The second component is the term premium, which includes compensation to investors for the risk of holding long-term bonds. The expectations component can change when the Fed provides information about the future path of short rates. In the aftermath of the Great Recession, the Fed’s forward guidance was meant to push down expectations of future short rates, lower longer-term yields, and ease financial conditions. In addition, if forward guidance results in a tighter distribution of short rate expectations around a future path, it can also reduce interest rate volatility and uncertainty, which can lower risk and term premia and further contribute to easier financial conditions.
To illustrate some of these effects, Figure 2 shows the actual funds rate (blue line) and financial investors’ midyear expectations for the path of the future funds rate (red dashed lines). Early in the recovery—during 2010 and 2011—market investors anticipated a quick policy rate liftoff. The upward sloping dashed lines starting in those years indicate near-term expected increases in the funds rate.
Figure 2
Actual and financial market expectations for fed funds rate
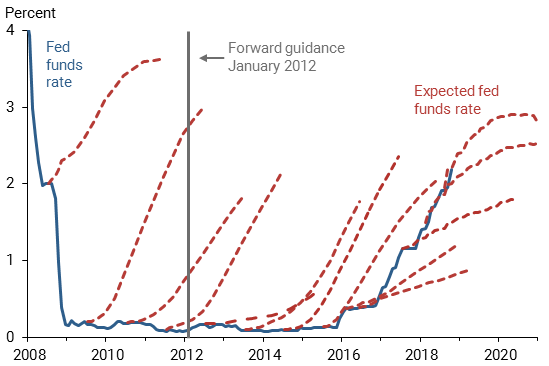
However, given the depth of the recession and associated measures of the conventional policy shortfall, the Fed did not view such an early liftoff as appropriate. To convey this assessment to investors, the Fed provided explicit forward guidance about the path of the future funds rate. For example, on January 25, 2012, the Federal Open Market Committee (FOMC) stated that “economic conditions…are likely to warrant exceptionally low levels for the federal funds rate at least through late 2014.” In that same month, the FOMC released participants’ numerical projections of the federal funds rate—the so-called “dot plot”—which showed that many of them expected liftoff to be years away. The gray line marks the date of these two releases of forward guidance that indicated that the funds rate was expected to remain at essentially zero for the next two years. Such forward guidance helped push down market expectations—flattening the dashed lines in 2012, 2013, and 2014—reducing longer-term yields and easing overall financial conditions.
During the past decade, forward guidance has generally been viewed as an effective policy tool to support the economic recovery. This is consistent with past episodes when the Fed also employed forward guidance although in a much more circumspect fashion. Still, forward guidance is not costless (Rudebusch and Williams 2008), and while it can be an important policy tool, the extent of its future use by the Fed is open to debate.
The Fed’s quantitative easing
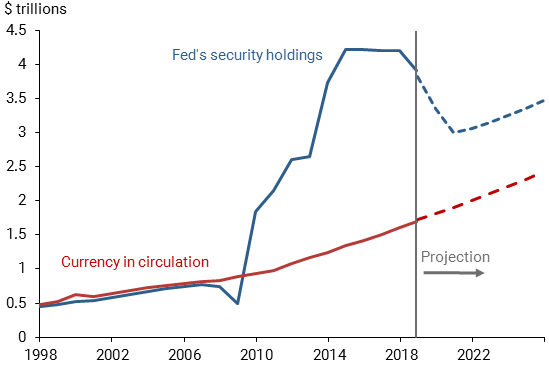
The Fed’s second unconventional monetary policy tool was quantitative easing, or QE, which involved Fed purchases of longer-term bonds. The gray line in Figure 3 plots the evolution of the Fed’s Treasury and agency bond holdings as a simple summary of its QE program. At the start of the crisis, these holdings were less than $1 trillion. Then, with three separate waves of purchases—QE1, QE2, and QE3—the Fed’s balance sheet increased to over $4 trillion.
Figure 3
Federal Reserve domestic security holdings and currency
These purchases are often thought to work through a straightforward demand–supply channel: greater Fed demand for bonds tends to push up bond prices, which pushes down yields. This “portfolio balance” channel requires some imperfect substitutability among financial assets and operates by reducing the term premium on longer-term yields. Bond purchases also may provide a signal about how the policy rate will be adjusted in the future—a form of forward guidance—and in this way, QE can also reduce the expectations component of yields (Bauer and Rudebusch 2014).
The balance sheet depicted in Figure 3 is a crude measure of QE for several reasons (Gagnon and Sack 2018). First, the effects of a QE purchase are likely to depend on the stock of bond holdings relative to size of the economy or relative to the aggregate size or riskiness of the bond market. As the economy grows larger, a fixed $100 billion purchase of securities will generally cause a smaller ripple in the bond market and a smaller effect on term premia. Second, a more precise measure of QE would take into account the maturity of the assets purchased. For example, purchases of short-term securities would be likely to have a smaller effect on 10-year yields than purchases of long-term securities. Finally, the effects of QE are also likely to depend on the expected time profile of the Fed’s holdings. A QE program is intrinsically a policy of forward guidance not about the short-term policy rate but about the expected time profile of the stock of Fed asset holdings.
Much evidence regarding the effects of QE comes from event studies that examine how asset prices shift in the hours after a Fed QE announcement (Christensen and Rudebusch 2012). For example, on March 18, 2009, the Fed announced that it would be purchasing an additional $300 billion of Treasury bonds. Although short-term interest rates were stuck near zero, longer-term rates fell immediately, with the 10-year Treasury yield declining about ½ percentage point. Of course, such immediate responses are not a good measure of the effects of QE if they are reversed in a few days or weeks, and the possibility of such reversals is one reason why the economic impact of QE is still debated. On the one hand, Greenlaw et al. (2018) argue that QE had a very small and erratic effect on financial conditions and the economy. By contrast, Gagnon and Sack (2018), drawing on a variety of research studies that examine the consequences of the Fed’s QE purchases, argue that the Fed’s total QE program was roughly equivalent to a cut in the federal funds rate of several percentage points.
As economic conditions turned more favorable, the Fed started to reduce the size of its balance sheet in 2017 by limiting the replacement of maturing securities in its portfolio. The dashed lines in Figure 3 show a possible future scenario for this policy normalization given in an April 2018 report on open market operations from the New York Fed. The Fed’s balance sheet is not projected to return to a pre-crisis level for two key reasons. First, the economy has grown, and there is now about twice as much U.S. currency in circulation than at the start of the financial crisis, which commensurately boosts the size of the Fed’s balance sheet. Future currency growth is also projected to continue assuming that dollars remain desirable for payments and as a store of value. Second, along with more currency, this scenario projects substantially more reserves in the financial system. In part, these reserves reflect greater precautionary demand for liquidity by many private financial institutions since the crisis. This reserve cushion also represents a possible shift away from a pre-crisis monetary policy regime of operating with scarce reserves to one with abundant reserves.
Conclusion
Unconventional policy was born of necessity given the financial crisis, deep recession, and near-zero short-term interest rates. Such extraordinary circumstances may not be often repeated, in which case, the unconventional monetary policy toolbox may sit on the shelf for some time. However, interest rates have trended lower in recent decades, reflecting low inflation and persistently low inflation-adjusted interest rates in the wake of an aging population and low productivity growth. If this situation continues, the lower bound on interest rates is likely to constrain short-term interest rates again and pave the way for further use of unconventional policy.
Glenn D. Rudebusch is senior policy advisor and executive vice president in the Economic Research Department of the Federal Reserve Bank of San Francisco.
References
Bauer, Michael D., and Glenn D. Rudebusch. 2014. “The Signaling Channel for Federal Reserve Bond Purchases.” International Journal of Central Banking 10(3, September), pp. 233–289.
Christensen, Jens H.E., and Glenn D. Rudebusch. 2012. “The Response of Interest Rates to U.S. and U.K. Quantitative Easing.” Economic Journal 122, pp. F385–F414.
Gagnon, Joseph E., and Brian Sack. 2018. “QE: A User’s Guide.” Peterson Institute for International Economics, Policy Brief 18-19, October.
Greenlaw, David, James D. Hamilton, Ethan Harris, and Kenneth D. West. 2018. “A Skeptical View of the Impact of the Fed’s Balance Sheet.” NBER Working Paper 24687.
Kuttner, Kenneth. 2018. “Outside the Box: Unconventional Monetary Policy in the Great Recession and Beyond.” Journal of Economic Perspectives 32(4), pp. 121-46.
Rudebusch, Glenn D., and John C. Williams. 2008. “Revealing the Secrets of the Temple: The Value of Publishing Central Bank Interest Rate Projections.” In Monetary Policy and Asset Prices, ed. John Campbell. Chicago: University of Chicago Press, pp. 247–284.
Opinions expressed in FRBSF Economic Letter do not necessarily reflect the views of the management of the Federal Reserve Bank of San Francisco or of the Board of Governors of the Federal Reserve System. This publication is edited by Anita Todd and Karen Barnes. Permission to reprint portions of articles or whole articles must be obtained in writing. Please send editorial comments and requests for reprint permission to research.library@sf.frb.org