
U.S. output has expanded only slowly since the recession trough in 2009, counter to normal expectations of a rapid cyclical recovery. Removing cyclical effects reveals that the deep recession was superimposed on a sharply slowing trend in underlying growth. The slowing trend reflects two factors: slow growth of innovation and declining labor force participation. Both of these powerful adverse forces were in place before the recession and, thus, were not the result of the financial crisis or policy changes since 2009.
Since the end of the severe recession of 2007–09, forecasters and policymakers have been persistently overoptimistic about the pace of future economic growth (Lansing and Pyle 2015). Despite steady improvements in the labor market, and despite a somewhat stronger performance in 2017, output growth has been relatively slow.
This Letter reviews the arguments from our paper (Fernald, Hall, Stock, and Watson 2017) that the disappointing recovery reflects a deep recession superimposed on a slowing trend in output per person. As we explain, that slowing trend largely reflects the forces of slow productivity growth and a declining labor force participation that were in play before the recession. In other words, the slowing trend was not in itself the result of the recession, associated financial disruptions, or policy changes since 2009.
Removing the cyclical rebound
Figure 1 shows business-sector output per person in recent decades. The green line shows that output per person fell sharply during the recession and, as of this writing, remains below any reasonable linear trend line extending its pre-recession trajectory. The figure shows one such trend line (yellow line), based on a simple linear extrapolation from 2003 to 2007.
Figure 1
Output per capita: Deep recession plus a sharp slowing trend
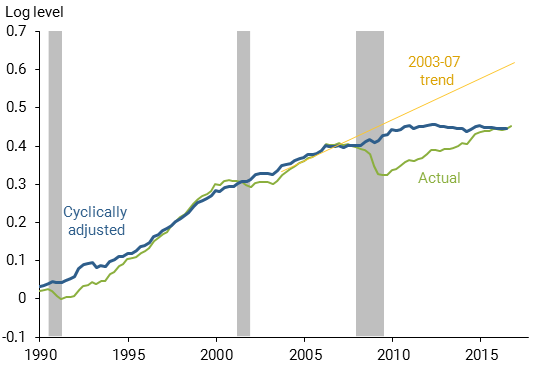
Note: Actual data are normalized to zero in 1991:Q1. Cyclically adjusted series data are set to have same level as actual data in 2007:Q3. Log scale implies a straight line is a constant growth rate.
To correctly estimate the underlying trend in Figure 1, we must adjust actual output for the fact that, after 2009, the U.S. economy was in a cyclical recovery from a deep recession. The unemployment rate peaked at 10% in late 2009, and the economy needed above-trend growth to bring that rate down.
One way we estimate cyclical effects is through what’s known as Okun’s (1962) law. The approach takes into account the consistent statistical relationship between changes in output and changes in the unemployment rate: When the unemployment rate rises, output growth tends to fall short of its trend pace, and vice versa. Daly et al. (2014) find that Okun’s law has held up reasonably well in the post-2007 period for the United States because the unemployment rate has been a fairly reliable cyclical indicator.
The blue line in Figure 1 shows the resulting estimate of trend output per capita after removing the cyclical effects associated with the deep recession. As expected, the cyclical adjustment removes the sharp drop in actual output associated with the recession. But since then, the trajectory of the blue line is nowhere close to a straight line projection from the 2007 peak. Rather, cyclically adjusted output per person rose slowly after 2007 and then plateaued in recent years.
To understand whether the slowing trend was caused by or independent of the recession, we relate output growth to its proximate supply-side determinants.
Why has productivity growth been slow?
The most common measure of the economy’s overall efficiency is labor productivity, or output per hour worked. Labor productivity can rise for three reasons. First, physical and intangible investment can increase the equipment, structures, and intellectual capital available to workers. When firms invest in new plants or automate a process, each worker has more or better “tools,” or capital, and should be able to produce more. Second, workers can acquire new skills through education and experience. And third, innovation, broadly construed, can make both equipment and labor more productive.
Our analysis shows that the important factor explaining the shortfall in productivity during the recovery is the third factor, innovation. Economists typically measure the economy-wide effects of innovation indirectly as the residual part of productivity growth that cannot be explained by other factors. This measure is known as total factor productivity (TFP). In the long run, TFP captures the productivity benefits from formal and informal research and development, improvements in management practices, reallocation of production toward high productivity firms, and other efficiency gains.
The green line in Figure 2 shows TFP, and the blue line shows our estimate of cyclically adjusted TFP. With either measure, growth picked up in the mid-1990s and slowed in the mid-2000s—before the recession—and then was flat or even falling going into the recession. In our paper, we used a variety of statistical approaches to confirm this visual impression regarding the timing.
Figure 2
Pre-recession slowdown in quarterly TFP growth
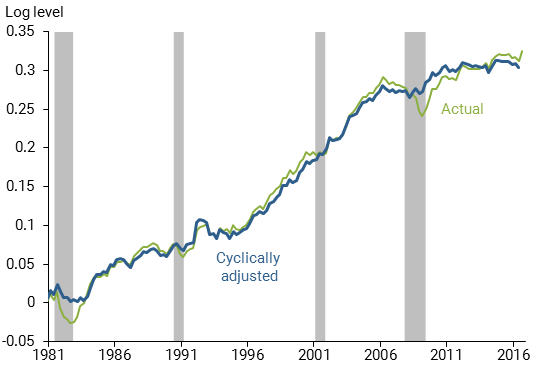
Note: Actual data are normalized to zero in 1983:Q1. Cyclically adjusted series are set to have same mean level as actual data over the period shown. Log scale implies a straight line is a constant growth rate.
One plausible hypothesis for the decline in TFP growth is that the recession itself slowed the pace of innovation. For example, a recession is not necessarily the best time to introduce a new product. Also, credit might be tight for entrepreneurs, even if they want to introduce a new product. But because the slowdown in TFP growth occurred before the recession, the recession could not have caused it.
A second hypothesis is that mismeasurement might have gotten worse over the past decade, causing growth to be increasingly understated. There’s no question that the statistical challenges are substantial and that many of the benefits of information technology (IT) are unmeasured. However, Byrne, Fernald, and Reindorf (2016) show that such mismeasurement has long been present, and there’s no evidence it has worsened over time.
A third hypothesis is that increased regulatory burdens have reduced the economy’s dynamism. Both dynamism and regulation are certainly related to productivity. The process of productivity growth is inherently dynamic and involves reallocating resources from less productive to more productive uses. However, we are unable to find any statistical link between U.S. industry productivity growth and changes in industry-specific federal regulations. That is, variations in regulation do not seem to be the main factor in the U.S. data.
A final hypothesis suggests the economy had already returned to normal after an exceptional decade of growth linked to IT developments. This is our preferred explanation, consistent with Fernald and Wang (2015) and Gordon (2016). Every story in the late 1990s and early 2000s emphasized the transformative role of IT, often suggesting a sequence of one-off gains—reorganizing retailing, say. Plausibly, businesses plucked the low-hanging fruit; afterward, the exceptional growth rate came to an end.
The important point for our analysis is that the slow pace of productivity growth was not caused by the recession and slow recovery itself. Rather, the slow trend predated the recession.
Falling labor force participation
Employment trends have also contributed to the flat trend in output. Certainly, employment has grown strongly in the recovery, but much of that was simply a cyclical recovery from the dramatic declines seen during the recession. After controlling for those cyclical movements, recent employment trends have been very weak relative to historical trends. This weakness turns out to reflect a sharp decline in labor force participation. A labor force participant is defined as someone who is either employed or actively looking for a job; Figure 3 shows labor force participation as a share of the civilian noninstitutional population ages 16 and older. In 2016, the rate was 3 percentage points below its value at the 2009 recession trough. The blue line removes cyclical effects. While various methods provide modestly different estimates of the cyclical component of the decline in the participation rate early in the recovery, by 2016 they all find that the cyclical contribution was small.
Figure 3
Sharp declines in labor force participation rate
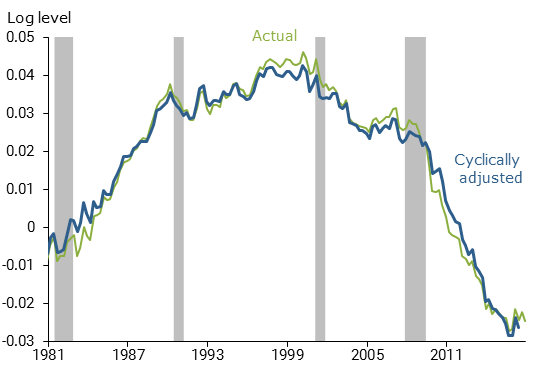
Note: Actual data are normalized to zero in 1983:Q1. Cyclically adjusted series are set to have same mean level as actual data over the period shown. Log scale implies a straight line is a constant growth rate.
The retirement of the baby boomers is an important factor behind the decline in labor force participation. For example, the leading edge of the baby-boom generation turned 65 in 2011. Some factors partially push the other way, such as higher education levels of older workers today relative to older workers in the past. We estimate that, taken together, demographic effects account for half or more of the decline in participation.
Changes in participation rates within detailed demographic groups account for the remainder of the decline. It is unlikely that this remainder is simply a consequence of the increase in unemployment during the 2007–09 recession. For example, the twin recessions of the early 1980s did not lead to comparable declines in participation relative to the trend.
Rather, as with productivity, the changes in participation within groups appear to largely reflect underlying trends that predated the recession. For example, Bidder, Mahedy, and Valletta (2016) point out that participation rates among workers in their prime working years (ages 25 to 54) have been trending down since around 2000, in part reflecting ongoing declines in labor market opportunities for some potential workers that predate the recession.
Conclusion
Some commentators have viewed the generally sluggish recovery from the deep U.S. recession of 2007–09 as a lingering consequence of financial and economic disruptions, perhaps reinforced by post-2008 regulatory changes. In this Letter, we find that neither of these are the main story of a slowing trend that, to an important extent, predated the recession. The seeds of the disappointing growth in output were sown before the recession in the form of slow productivity growth and a declining labor force participation rate.
Quantitatively, relative to the recoveries of the 1980s, 1990s, and early 2000s, cyclically adjusted output per person has grown about 1¾ percentage points per year more slowly since 2009. According to our analysis, about a percentage point of this is explained by the shortfall in productivity growth and about ¾ percentage point is explained by the shortfall in labor force participation. Other factors are small and offsetting.
Although the magnitude of the trend slowdown has surprised forecasters, the underlying forces were recognized before the recession. For example, Aaronson et al. (2006) forecasted declines in participation as the baby-boom generation retired and the 1960s to 1980s surge of women into the paid labor force plateaued. Similarly, Fernald, Thipphavong, and Trehan (2007) discussed the post-2004 slowdown in productivity.
Finally, it is important to recognize that our findings do not imply that the recession was not enormously costly. Indeed, the collapse in demand during the recession and financial crisis contributed to the slow return of output to a trend rate that was already slowing sharply.
John Fernald is a senior research advisor in the Economic Research Department of the Federal Reserve Bank of San Francisco and the Shroders Chair in European Competitiveness and Reform and a professor of economics at INSEAD.
Robert E. Hall is Robert and Carole McNeil Joint Hoover Senior Fellow and Professor of Economics at Stanford University.
James H. Stock is the Harold Hitchings Burbank Professor of Political Economy at Harvard University.
Mark W. Watson is the Howard Harrison and Gabrielle Snyder Beck Professor of Economics and Public Affairs at Princeton University.
References
Aaronson, Stephanie, Tomaz Cajner, Bruce Fallick, Felix Galbis-Reig, Christopher Smith, and William Wascher. 2014. “Labor Force Participation: Recent Developments and Future Prospects.” Brookings Papers on Economic Activity, Fall, pp. 197–255.
Bidder, Rhys, Tim Mahedy, and Rob Valletta. 2016. “Trend Job Growth: Where’s Normal?” FRBSF Economic Letter 2016-32 (October 24).
Byrne, David M., John G. Fernald, and Marshall B. Reinsdorf. 2016. “Does the United States Have a Productivity Slowdown or a Measurement Problem?” Brookings Papers on Economic Activity, Spring, pp. 109–157.
Daly, Mary C., John G. Fernald, Òscar Jordà, and Fernanda Nechio. 2014. “Interpreting Deviations from Okun’s Law.” FRBSF Economic Letter 2014-12 (April 21).
Fernald, John G., Robert E. Hall, James H. Stock and Mark W. Watson. 2017. “The Disappointing Recovery of Output after 2009.” Brookings Papers on Economic Activity, Spring, pp. 1–58.
Fernald, John G., David Thipphavong, and Bharat Trehan. 2007. “Will Fast Productivity Growth Persist?” FRBSF Economic Letter 2007-09 (April 6).
Fernald, John G., and Bing Wang. 2015. “The Recent Rise and Fall of Rapid Productivity Growth.” FRBSF Economic Letter 2015-04 (February 9).
Gordon, Robert J. 2016. The Rise and Fall of American Growth: The U.S. Standard of Living since the Civil War. Princeton: Princeton University Press.
Lansing, Kevin J., and Benjamin Pyle. 2015. “Persistent Overoptimism about Economic Growth.” FRBSF Economic Letter 2015-03 (February 2).
Okun, Arthur M. 1962. “Potential GNP: Its Measurement and Significance.” Cowles Foundation for Research in Economics Paper 190, Yale University.
Opinions expressed in FRBSF Economic Letter do not necessarily reflect the views of the management of the Federal Reserve Bank of San Francisco or of the Board of Governors of the Federal Reserve System. This publication is edited by Anita Todd and Karen Barnes. Permission to reprint portions of articles or whole articles must be obtained in writing. Please send editorial comments and requests for reprint permission to research.library@sf.frb.org