
Thanks in large part to recently enacted tax cuts, U.S. fiscal policy has taken a decidedly procyclical turn—providing stimulus when the economy is growing. In fact, the projected increase in the federal deficit over the next few years would represent the most procyclical fiscal policy stance since the Vietnam War. This matters because many recent studies have found that fiscal stimulus has a smaller impact when the economy is strong, implying that the near-term boost to GDP growth could be two-thirds or less of that from previous tax cuts.
At the end of last year, Congress passed the most significant change in the U.S. tax code since 1986, the Tax Cuts and Jobs Act (TCJA). The Joint Committee on Taxation puts the size of the tax cuts at $1.5 trillion over 10 years, with about half of the revenue costs coming in the first three years due to the phase-out of some key provisions after 2020. Many macroeconomic forecasters expect the TCJA to significantly boost U.S. GDP growth over the next couple of years.
The tax act arrives at a time when the U.S. economy is well into its eighth year of expansion—one of the longest expansions since World War II—with resource utilization considered tight by nearly every measure.
Thus, the TCJA is in essence a large, mostly temporary tax cut hitting a hot economy—in other words, the stimulus is procyclical. In this Economic Letter, we assess just how procyclical the current and near-term fiscal policy is, how unusual this procyclicality is relative to past trends, and whether it matters for the macroeconomic effects of this stimulus.
The usual cyclicality of U.S. federal fiscal policy
From a macroeconomic perspective, the stance of federal fiscal policy can be summarized by movements in the primary deficit as a share of GDP. The primary deficit is the difference between federal government spending, excluding debt interest payments, and revenue. Historically, the deficit has been highly countercyclical, meaning that it rises during economic slowdowns and falls during expansions. This countercyclicality is driven by both the spending side and revenue side and by both discretionary or “activist” policies and automatic or “passive” policies. Discretionary policies are changes to government spending or taxation due to legislative actions, while automatic policies are previously enacted tax and spending programs that are triggered directly or indirectly by the state of the economy. On the revenue side, the federal tax base, formed primarily by individual incomes and corporate profits, and in turn tax revenue automatically grow faster in economic expansions than in recessions. In addition, federal policymakers often enact temporary tax relief packages during downturns, for example, the 2001 and 2008 tax rebates.
Conversely, government spending tends to be highly countercyclical. This is partly because a lot of government spending consists of so-called automatic stabilizer programs like unemployment insurance, Medicaid, and Temporary Assistance for Needy Families. These programs are designed such that the number of people eligible for benefits increases in economic downturns and decreases in expansions. In addition, federal policymakers often enact temporary increases in discretionary spending during downturns, as was the case with the 2009 American Recovery and Reinvestment Act.
To quantify the cyclicality of federal fiscal policy, we follow the approach of Lucking and Wilson (2012) in estimating the average relationship between the primary deficit and a measure of the business cycle. We measure the cycle using the output gap—the difference between potential GDP and actual GDP—according to the Congressional Budget Office. Using the CBO’s measure of the unemployment gap or the unemployment rate itself leads to very similar results. We estimate the relationship between the deficit, as measured by the Bureau of Economic Analysis (BEA), and the output gap using a regression analysis of quarterly data from 1960 through 2017. We then use that estimated relationship to infer the “cyclical component” of the deficit, shown as the red line in Figure 1. The actual deficit is shown as the blue line. Note that the BEA’s quarterly deficit data include a large transitory adjustment of $250 billion in the fourth quarter of 2017 to reflect the accrual of foreign assets of U.S. corporations that became subject to the TCJA’s new repatriation tax. We remove this one-time blip from the chart for visual clarity. The grey bars indicate recession periods, according to the National Bureau of Economic Research.
Figure 1
Federal primary deficit and its cyclical component
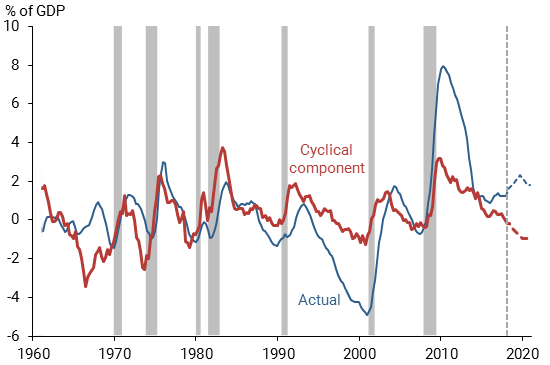
Source: BEA, CBO, and authors’ calculations. Gray bars indicate NBER recession dates.
The countercyclical nature of the deficit discussed above is clear in Figure 1. The cyclical component series demonstrates how strong this pattern is. The cyclical deficit typically climbs during times of recession, then falls as the economy recovers. In fact, since World War II, the only time the deficit was notably procyclical—that is, divergent from its cyclical component—was in the late 1960s, when the nation was engaged in the Vietnam War; at that time, military outlays, and hence overall government spending, rose sharply in the midst of a prolonged economic expansion.
Fiscal policy projections
The dashed lines to the right of the vertical dashed line in Figure 1 are projections through the end of 2020. We project the actual primary deficit using the CBO’s most recent annual projections from the April 2018 Budget and Economic Outlook, interpolated to a quarterly frequency. We project the cyclical component by plugging the CBO’s output gap projection into our estimate of the historical relationship between the output gap and the deficit.
We find that, while the cyclical component of the deficit is expected to fall in the next few years, the actual deficit is projected to rise. This divergence in the directions of the deficit and its cyclical component suggests that U.S. federal fiscal policy is expected to be strongly procyclical over the next few years. Based on historical trends, this projected divergence between the actual deficit and its cyclical component is highly unusual.
Implications of fiscal policy in good times
The projected procyclical policy over the next few years may raise concerns regarding the nation’s fiscal capacity to respond to future downturns and its ability to manage the growing federal debt. However, it also has important implications for the macroeconomic impact of the fiscal stimulus represented by the TCJA and the consequent increase in the deficit.
A burgeoning economic literature has studied whether fiscal stimulus affects the macroeconomy differently in good times than it does in bad times. Some studies directly estimate the so-called fiscal multiplier—the response of GDP to a policy change affecting government spending or tax revenue—and test whether this multiplier depends on the state of the economy. This is challenging given the historical rarity of stimulative fiscal policy in good times or contractionary fiscal policy in bad times at the federal level. Therefore, researchers have typically turned to data at the state level or from other countries to estimate separate fiscal multipliers for procyclical and countercyclical stimulus.
The predominant research finding is that the fiscal multiplier is smaller during expansions than during recessions. For example, Nakamura and Steinsson (2014) and Leduc and Wilson (2012) estimate state-level GDP multipliers on federal military spending and federal highway spending, respectively, and find that the spending multiplier tends to be much larger in states experiencing more resource slack from such things as higher unemployment. Similarly, Shoag (2010) finds that the response of employment and personal income to a boost in state government spending increases with the level of a state’s unemployment rate.
Auerbach and Gorodnichenko (2012) and Jordá and Taylor (2016) estimate the national GDP multiplier on government spending using a panel of countries in the Organisation for Economic Co-operation and Development and find that the multiplier is considerably smaller in expansions than in recessions. There are few contrary studies, but one prominent case is Ramey and Zubairy (2018), which estimates the multiplier on defense-driven government spending in the United States using a historical data set going back to 1889. The long history and focus on defense spending helps overcome the empirical challenges posed by the rarity of procyclical federal spending boosts. Ramey and Zubairy find that the GDP multiplier for this spending is relatively low and is independent of the state of the economy.
These studies focus on the multiplier based on government spending. There has been scant empirical research on the link between the state of the economy and the macroeconomic impacts of tax changes. Again, the rarity of procyclical tax cuts or countercyclical tax hikes helps explain this scarcity of research. However, microeconomic research on the state of the economy and “marginal propensities to consume” (MPCs) offer important insights because standard economic theory draws a tight link between them and fiscal tax multipliers, which measure the growth in the economy generated from a dollar of tax cuts. An individual’s MPC is the fraction of a dollar of new income that he or she spends.
Numerous microeconomic studies have shown that individuals who are liquidity constrained—meaning that they are unable to borrow or easily liquidate assets to finance spending—tend to have higher MPCs. Since the proportion of the population that is liquidity constrained generally falls during expansions, these results suggest that the average MPC in the economy, and in turn the fiscal multiplier, should also fall in expansions. In addition, a recent paper by Gross, Notowidigdo, and Wang (2018) finds that the MPC was 20-30% higher in the Great Recession compared with other recent years. Given the standard theoretical link between the MPC and the multiplier, this finding implies that the tax multiplier in recessions is at least 20-30% higher than in expansions.
To put the above results in perspective, note that a number of macroeconomic forecasters expect the TCJA to boost 2018 GDP growth by around a percentage point. The literature discussed above suggests the true boost is more likely to be well below that, as small as zero according to some studies.
Conclusion
Recent U.S. federal fiscal policy has taken a decidedly procyclical turn, driven primarily by the large and front-loaded tax cuts enacted by the 2017 Tax Cuts and Jobs Act. Many analysts have forecast large increases in GDP growth over the next two to three years as a result. However, recent research finds that the effects of fiscal stimulus on overall economic activity are much smaller during expansions than during downturns. This suggests these forecasts may be overly optimistic.
Tim Mahedy is a former associate economist in the Economic Research Department of the Federal Reserve Bank of San Francisco.
Daniel J. Wilson is vice president in the Economic Research Department of the Federal Reserve Bank of San Francisco.
Correction, July 10, 2018: This revision removes an inaccurate description of the CBO’s estimate of the impact of the TCJA on 2018 GDP growth.
References
Auerbach, Alan, and Yuriy Gorodnichenko. 2012. “Measuring the Output Responses to Fiscal Policy.” American Economic Journal: Economic Policy 4(2), pp. 1–27.
Gross, Tai, Matthew J. Notowidigdo, and Jialan Wang. 2018. “The Marginal Propensity to Consume Over the Business Cycle.” Unpublished manuscript, Northwestern University.
Jordà, Òscar, and Alan M. Taylor. 2016. “The Time for Austerity: Estimating the Average Treatment Effect of Fiscal Policy.” Economic Journal 126(590), pp. 219–255.
Leduc, Sylvain, and Daniel J. Wilson. 2012. “Roads to Prosperity or Bridges to Nowhere? Theory and Evidence on the Impact of Public Infrastructure Investment.” NBER Macroeconomics Annual 27(1), pp. 89-142.
Lucking, Brian, and Daniel J. Wilson. 2012. “U.S. Fiscal Policy: Headwind or Tailwind?” FRBSF Economic Letter 2012-20 (July 2).
Nakamura, Emi, and Jón Steinsson. 2014. “Fiscal Stimulus in a Monetary Union: Evidence from U.S. Regions.” American Economic Review 104(3), pp. 753–792.
Ramey, Valerie, and Sarah Zubairy. 2018. “Government Spending Multipliers in Good Times and in Bad: Evidence from U.S. Historical Data.” Journal of Political Economy 126(2), pp. 850–901.
Shoag, Daniel. 2010. “The Impact of Government Spending Shocks: Evidence on the Multiplier from State Pension Plan Returns.”
Opinions expressed in FRBSF Economic Letter do not necessarily reflect the views of the management of the Federal Reserve Bank of San Francisco or of the Board of Governors of the Federal Reserve System. This publication is edited by Anita Todd and Karen Barnes. Permission to reprint portions of articles or whole articles must be obtained in writing. Please send editorial comments and requests for reprint permission to research.library@sf.frb.org