
The yield spread between long-term and short-term Treasury securities is known to be a good predictor of economic activity, particularly of looming recessions. One way to learn more is through a careful scrutiny of the historical variation of such yield spreads and how they relate to the current slope of the Treasury yield curve. The results suggest that the recent flattening of the yield curve implies only a slightly elevated risk of a recession in the near term relative to any other month.
An inverted Treasury yield curve—a negative term spread in which long-term securities earn a lower rate of return than short-term securities—has been well established as a reliable real-time predictor of future recessions (Bauer and Mertens 2018). What a positive but declining slope of the yield curve might imply for the economic outlook has garnered less attention. Nevertheless, answering this question has become increasingly important given the ongoing gradual normalization of U.S. monetary policy, which has raised short-term interest rates almost 2 percentage points since December 2015. Because long-term yields have increased much less, the Treasury yield curve has flattened, raising speculation about whether these changes may signal a rising risk of recession.
In this Letter, I describe the connection between investors’ expectations about changes in the stance of monetary policy and Treasury yields and offer a possible explanation why an inverted yield curve precedes and hence predicts recessions. I use both a simple descriptive approach and a more sophisticated analysis based on a dynamic model of the Treasury yield curve to shed light on the connection between the current yield curve slope, expectations about its future movements, and the risk of a recession. Both of these exercises suggest that, although the yield curve has flattened notably in recent years, the risk of a recession occurring within the next year is only slightly higher than the risk of being in a recession in any given month. Furthermore, unique structural factors may be weighing down long-term yields, pushing down the slope of the yield curve and hence overstating the risk of a recession.
Monetary policy and the yield curve
Due to its dual mandate of maximum employment and price stability, the Fed has a long history of responding to recessions by lowering its primary policy interest rate, the overnight federal funds rate, to ease financial conditions. Rational investors in financial markets anticipate such routine changes in the stance of monetary policy and build them into their trading strategies, thereby affecting the slope of the Treasury yield curve. Specifically, long-term Treasury yields start to level off or even drop in anticipation of a looming recession and associated monetary policy easing, which causes the yield curve to flatten. As the risk of recession grows, the Treasury yield curve turns negative in the months before the actual onset, which explains the enduring power of an inverted yield curve as a real-time predictor of future recessions. Moreover, even if a recession were not looming, downbeat investors seeking safe investments could buy up long-term securities, causing long-term rates to lower and thus contributing to tighter financial conditions and an economic downturn.
If history is a guide to the future, the question is, what does the current slope of the Treasury yield curve imply regarding investors’ views about the current risk and timing of a recession, assuming that they believe the Fed would lower interest rates as usual in response to an economic downturn?
Simple calculations based on interest rate movements over the past three decades can provide an initial rough answer. Figure 1 shows the daily overnight federal funds rate targeted by the Fed (gold line) and the daily yield difference between the ten-year and two-year Treasury yields (blue line) taken from Gürkaynak, Sack, and Wright (2007), which I use as the slope measure. As of August 31, 2018, this yield spread was 0.24% (horizontal dashed line), well below its unconditional mean of 1.35% based on the daily data since December 1, 1987. The figure also highlights four times the slope of the yield curve had a similarly low value in the later stages of an ongoing monetary policy tightening cycle. Three of these led to a yield curve inversion shortly thereafter (red dots), while one was a false positive with no immediate subsequent inversion (green dot). Note that I don’t include the brief yield curve flattening in the fall of 1994 because it was quickly reversed, unlike the other four episodes. Finally, gray bars indicate the three recessions during this period as determined by the National Bureau of Economic Research (NBER), while light blue vertical lines indicate the days when U.S. monetary policy reached its peak ahead of those recessions.
Figure 1
Fed policy rate and the slope of the Treasury yield curve
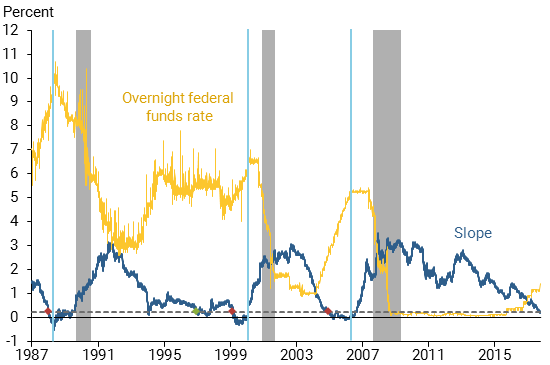
Scrutinizing the key event dates around the three most recent recessions reveals that it took between 96 and 227 days from the day the slope of the Treasury yield curve reached its current level (0.24%) until monetary policy peaked. November 19, 1997, is the sole false positive; during that episode, monetary policy did not peak but rather the policy rate was eased such that the yield curve never inverted.
The second phase between the peak of monetary policy tightening and the beginning of a recession lasted between 287 and 516 days. This back-of-the-envelope analysis suggests that there is a one-in-four chance that the current low slope will have no negative implications for future economic growth, as in November 1997. Data from the remaining three outcomes when a similarly flat yield curve ended with an inversion and subsequent recession suggest that this result could take from a little over a year to about two years to occur. Hence, this analysis suggests only a modest risk of a recession within the next year despite the relatively flat yield curve.
Evidence from a yield curve model
To complement the descriptive analysis, I use a model that describes the relationship between bond yields of different maturities, known as a term structure model, specifically one identified by Christensen and Rudebusch (2012). The model’s three factors represent the general level of interest rates, the slope of the yield curve, and any humps in the shape of the yield curve. The factors only indirectly reflect the connection between the state of the economy and the stance of monetary policy. Instead, the constellation of these three factors implied by the current Treasury yield curve and their historical dynamic relationship determine the chance of observing a given shape of the yield curve in the future.
Based on the estimated factor values and model dynamics as of August 31, 2018—which reflect the shape of the Treasury yield curve and investors’ embedded expectations as of that day—I project 10,000 possible paths for the yield curve up to ten years ahead. Along each ten-year path, I convert the projected yields at monthly intervals into forecasts of the yield curve slope, defined as the difference between the ten-year and two-year yields. Figure 2 shows the median projection and the values within a 90% confidence band for the simulated slope over the ten-year forecast.
Figure 2
Projections of the slope of the Treasury yield curve
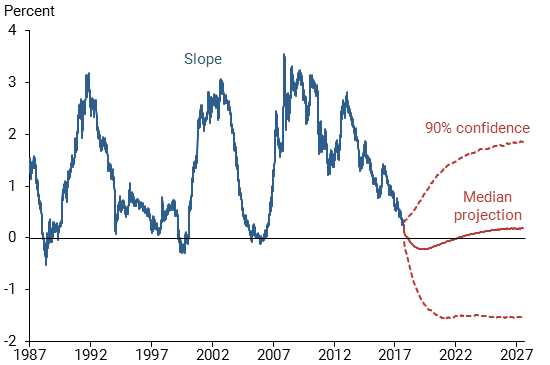
The median slope projection turns negative by year-end 2018 and reaches a low of –0.22% during the first quarter of 2020 before gradually reversing to a stable longer-run level near 0.2%. The upper confidence band implies a reversal to a fairly steep yield curve normally seen in the early stages of economic recoveries that reaches 1% in the fall of 2020 and approaches 2% by mid-2027. In contrast, the lower band represents an unusual, persistently negative slope that dips below –1% in the fall of 2019. Thus, a wide range of outcomes is possible within the 90% confidence band, which underscores the inherent uncertainty in making economic projections, even in the near term.
It is important to emphasize that the projections in Figure 2 do not represent paths from a single simulation over the forecast horizon; instead, they reflect the distribution of all simulation outcomes at each point in time. Hence, an individual simulation varies over time and generally is not as smooth as the median projection, seesawing and often turning negative for limited periods. Therefore, as an alternative, I track individual simulated paths and define a yield curve inversion as one lasting at least three months to exclude short-lived near-zero gyrations like in the fall of 1994. Among the individual simulations, 16% have no inversions over the ten-year projection horizon. The remaining 84% project an inversion at some point over the next ten years. The median time before the first yield curve inversion in the conditional probability distribution is seven months; there is a 61% chance of an inversion within the first year and an 8% chance between the first and second year.
Combining these results with the fact that over the past three decades the subsequent recessions have started 9 to 18 months after the initial inversion of the Treasury yield curve, the risk of a recession happening within the next year is slightly elevated—with around a one-in-three chance of a yield curve inversion within the next three months. Still, this leaves a high chance that the current economic expansion will continue beyond June 2019 and become the longest in U.S. history. For perspective, in the post-World War II era from October 1945 to August 2018 (875 months), the U.S. economy has been in recession 123 months according to the NBER. From these numbers, the risk of being in a recession in any given month is 14%, thus not entirely negligible.
One important caveat is that long-term Treasury yields have been unusually low for many years (Bauer and Rudebusch 2016), which is reflected in the estimated model dynamics. This could be caused by declines in the risk-free or natural real rate from low productivity or an aging population (Christensen and Rudebusch 2017), or by the massive long-term asset purchases by major central banks in the aftermath of the global financial crisis (Bonis, Ihrig, and Wei 2017). In either case, U.S. long-term yields may react less to increases in U.S. short-term interest rates than past experience would suggest. All else being equal, such factors would make it more likely that an inverted yield curve may not signal expectations among investors of a looming recession, unlike the assumption in this Letter. Therefore, these results should be viewed as upper bound estimates of the actual risk of a recession.
Conclusion
In this Letter, I analyze what the recent flattening of the U.S. Treasury yield curve may imply for the timing of a yield curve inversion and the economic outlook. Using both a descriptive approach and evidence from a dynamic model of Treasury yields, I find that the risk of a recession within the next year is only slightly higher than the risk of being in a recession in any random month. Hence, at this time, it may be warranted to not put too much weight on the signal from the yield curve flattening, particularly in light of structural factors that may be weighing down long-term yields and causing the signal to be less reliable than in the past.
Jens H.E. Christensen is a research advisor in the Economic Research Department of the Federal Reserve Bank of San Francisco.
References
Bauer, Michael D., and Thomas M. Mertens. 2018. “Economic Forecasts with the Yield Curve.” FRBSF Economic Letter 2018-07 (March 5).
Bauer, Michael D., and Glenn D. Rudebusch. 2016. “Why Are Long-Term Interest Rates So Low?” FRBSF Economic Letter 2016-36 (December 5).
Bonis, Brian, Jane Ihrig, and Min Wei. 2017. “The Effect of the Federal Reserve’s Securities Holdings on Longer-Term Interest Rates.” Board of Governors FEDS Notes, April 20.
Christensen, Jens H.E., and Glenn D. Rudebusch. 2012. “The Response of Interest Rates to U.S. and U.K. Quantitative Easing.” Economic Journal 122, pp. F385–F414.
Christensen, Jens H.E., and Glenn D. Rudebusch. 2017. “New Evidence for a Lower New Normal in Interest Rates.” FRBSF Economic Letter 2017-17 (June 19).
Gürkaynak, Refet S., Brian Sack, and Jonathan H. Wright. 2007. “The U.S. Treasury Yield Curve: 1961 to the Present.” Journal of Monetary Economics 54(8), pp. 2,291–2,304.
Opinions expressed in FRBSF Economic Letter do not necessarily reflect the views of the management of the Federal Reserve Bank of San Francisco or of the Board of Governors of the Federal Reserve System. This publication is edited by Anita Todd and Karen Barnes. Permission to reprint portions of articles or whole articles must be obtained in writing. Please send editorial comments and requests for reprint permission to research.library@sf.frb.org