
When U.S. shoppers buy something imported, are they also paying for local inputs? How much of what is “Made in the U.S.A.” actually is? These questions require accounting for both the U.S. components in the price of imported goods and the use of imported inputs in U.S. production. Estimates show that nearly half of spending on imports stays in the United States, paying for the local components of these goods. Over 10 cents of every dollar U.S. consumers spend reflects the cost of imports at various stages of production.
News about trade policy discussions in recent months demonstrate the importance of understanding how much the U.S. economy relies on imports. We frequently hear about the increasing importance of imports of so-called intermediate goods to U.S. production (Parilla 2017 and USITC 2017). But exactly how much do imports contribute to U.S. consumption?
In this Economic Letter, we answer this question by examining the most recent consumption and trade data available. Our calculations take into account two important factors: the U.S. domestic component in the price of imported goods and the amount U.S. companies spend on imported intermediate inputs. These calculations help explain the importance of imports for U.S consumers and businesses.
Our estimates show that nearly half the amount spent on goods and services made abroad stays in the United States, paying for the local component of the retail price of these goods. At the same time, imports of intermediate inputs make up about 5% of the cost of production of U.S. goods and services. Overall, about 11% of U.S. consumer spending can be traced to imported goods. This ratio has remained nearly unchanged in the past 15 years, although the relative importance among the major U.S. trading partners has changed somewhat during that time. In particular, the share spent on Chinese goods has increased at the expense of goods and services made in Japan.
The mix of makers in U.S. goods and imports
When you buy a $100 pair of Nike sneakers made in Asia, only $25 of its cost goes to the Asian factory that assembles the shoes (Kish 2014). Of the remaining $75, $3.50 is spent on shipping from Asia to the United States, and $21.50 goes to Nike to cover its design, marketing, profits, and other expenses. The remaining $50 goes to the U.S. retailer that pays for the transportation of the sneakers inside the United States, worker wages in its U.S. warehouses and retail outlets, rental cost of retail space, insurance, and so on. Thus, half the cost of a pair of sneakers made abroad pays for workers and capital expenditures in the United States, not even counting the part that goes to Nike.
When you buy a Jeep Patriot manufactured in Illinois, at least 17% of the cost goes to parts made in other countries (NHTSA 2017). Thus, even for a car that is manufactured in the United States, a substantial part of its cost traces to imported intermediate parts used in its production.
These examples are useful to understand how raw statistics on imports fail to fully account for the cost of imports, and how part of the cost of American goods and services reflects imports. To account for these factors—namely, the U.S. content of goods sold as imports and the import content of goods sold as “Made in the U.S.A.”—we combine information from the 2017 Census Bureau U.S. International Trade Data, the 2016 Bureau of Labor Statistics input-output matrix, and the 2017 personal consumption expenditures (PCE) from the U.S. national accounts.
Share of spending on imports
While shoppers are used to seeing various imported items—like Nike shoes—in stores across the country, the United States remains a relatively closed economy. In fact, the vast majority of goods and services sold here are produced domestically. Even in categories with high levels of imported goods, most expenditures are on domestic goods.
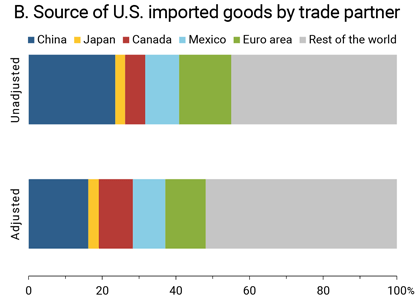
Figure 1, panel A summarizes the composition of U.S. PCE by category between durable goods, nondurable goods, and services. The exact numbers for all calculations are provided in the online Appendix. For each category the bar is split between the share of consumption spent on domestic goods (solid portion) and imported goods (lighter shaded portion). Panel B shows the source of overall imported goods and services by trading partner.
Figure 1
Domestic and import expenditure shares by categories and trade partners
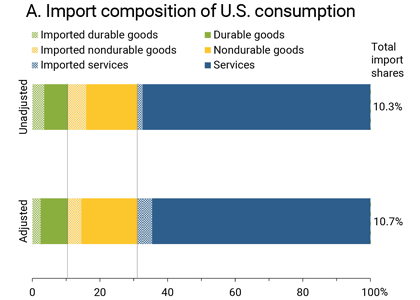
Note: Top bars in both panels are computed directly from PCE and headline trade data. Bottom bars in both panels reflect authors’ adjustments to account for imported content of U.S. goods and U.S. content of imported goods.
The top “unadjusted” bars in both panels report data computed directly from PCE and headline trade numbers, which classify trade in goods and services based on their country of origin. For now, we focus on the top bars and leave the discussion of the bottom “adjusted” bars for a later section.
Panel A shows that, as of 2017, the bulk of consumer spending went to services, followed by nondurable then durable goods. The panel also shows that the import share is highest, roughly one-third, for the consumption of durable goods, which includes cars and household electronics. Overall, the import share of U.S. personal consumer expenses only amounts to 10%.
Panel B shows that nearly a quarter of these expenditures are on goods and services made in China, while another quarter is made in the euro area and Mexico combined.
These unadjusted calculations are based on the total of the final values of goods sold as imported goods to consumers. While these calculations are informative, they miss the overall import content of final goods consumed in the United States in two important ways: the “local” content of imports, and the “foreign” content of domestically produced goods and services. We account for those in the adjusted numbers in the lower bars of the two charts, which we discuss next.
Local content of imported goods
In our first example, $75 of the cost of a $100 pair of sneakers made in Asia go to U.S. businesses, of which $50 goes to U.S retailers and logistics. These latter expenses are often referred to as local content of imports. Therefore, to accurately compute the share of PCE that goes to imports, one must subtract the local content from the amount consumers spend on imported goods.
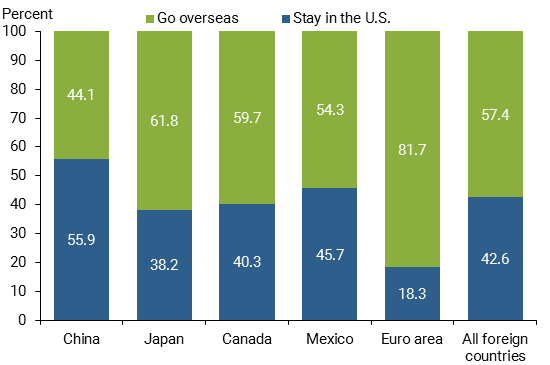
Figure 2 summarizes how expenditures on imports are distributed between the local content that stays in this country, imported content that goes overseas to our major trade partners, and overall (last bar). For example, of all consumer expenditures in goods that are made in China, more than half stays in the United States as payment for local content. For the United States as a whole, the overall share of local content of imports in the U.S. is about 43%. Detailed statistics are provided in the online Appendix.
Figure 2
Where do expenditures on “made in…” go?
Import content of “Made in the U.S.A.” goods
Thus far we have focused on goods that go directly to final consumption by U.S. consumers. However, not all of the goods and services that the United States imports are sold directly to households. Many imported items are used by U.S. companies as inputs in the production process, like the car parts used in the production of the Jeep Patriot. Hence, part of the 90% of spending on goods and services made in the United States use imported intermediate goods and services.
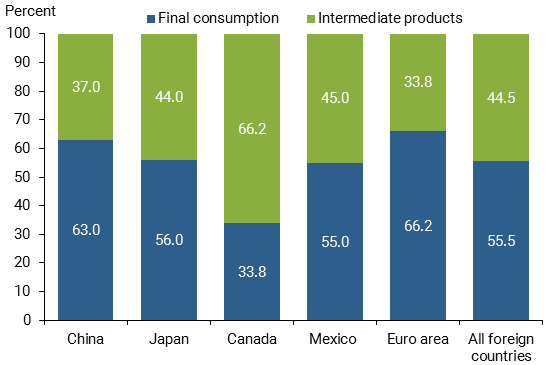
Figure 3 compares final goods imports adjusted for local content with the import content of U.S. goods and services, by trading partner and overall. Taking the aggregate numbers as an example, about 45% of U.S. imports reflect intermediate inputs to the production of American goods, while the remainder corresponds to imports of final consumption goods. These percentages mean that the import content of domestically produced goods and services (about 45%) amounts to nearly as much as the local content of the amount spent on imported final goods from Figure 2 (about 43%).
Figure 3
Where do imports “from…” go?
Putting everything together
To properly measure the share of U.S. consumer spending that goes to imported goods, we begin with the total amount consumers spend on final goods produced abroad, subtract the local content embedded in the prices of these goods, and add the import content in domestically produced goods and services. Putting everything together, we calculate the adjusted measures, shown in the bottom bars in Figure 1, of how much of the U.S. PCE comes from imported goods and services.
Focusing on Figure 1, panel A, the difference between the adjusted and unadjusted measures are especially pronounced for services. Once we subtract the local content of services and add imports of intermediate inputs, the total share of PCE that goes to imported services triples. Panel B shows that the difference between the adjusted and unadjusted measures is especially pronounced for imports from China. Once we subtract local content of imported goods and add imports of intermediates, the total share of PCE that goes to goods imported from China declines, highlighting the relative importance of the local content in the price of goods imported from China. Imports of intermediates are especially important in trade relationships with Mexico. Once we include imported intermediates, the share of expenses on Mexican goods and services offsets the local content in final goods imported from Mexico, leaving the share of Mexican imports in the U.S. PCE basically unchanged.
Note, however, that even after taking imported intermediate goods into account, the share of U.S. PCE that goes as payment to foreigners is quite small at 11%.
How have these numbers changed in recent years? To answer this question we calculated them using data since 2002. We found that the total import content of PCE has been relatively constant during the past 15 years, similar to the findings of Hale and Hobijn (2011). However, the share of Chinese imports has increased and the share of Japanese imports has declined. The import shares from Mexico, Canada, and the euro area have remained relatively constant. The fact that the overall import content of U.S. consumer goods has remained relatively constant while the Chinese share has increased demonstrates that Chinese gains have come, in large part, at the cost of other exporters, namely Japan.
Conclusion
There are three main takeaways from the analysis in this Letter. First, despite how individual shopping experiences may appear, the majority of U.S. personal consumption expenditures are on domestically produced goods and services. Second, nearly half of the amount we spend on imported goods stays in the United States to pay for the local component of the retail price of these goods. Third, almost half of the total expenditures on imports is embedded in the production of U.S. goods and services that use imported intermediate inputs. Taking all of these factors into account, import content in total PCE was just over 10% in 2017.
The high share of local content means that imports generate a number of transportation and retail jobs that might or might not be as numerous if these goods were produced in the United States. The relatively sizable role of imported intermediates means that, by raising producers’ costs, tariffs could boost not only the prices of imported goods but also the prices of domestically produced goods.
Galina Hale is a research advisor in the Economic Research Department of the Federal Reserve Bank of San Francisco.
Bart Hobijn is a professor at Arizona State University and a visiting scholar at the Federal Reserve Bank of San Francisco.
Fernanda Nechio is a research advisor in the Economic Research Department of the Federal Reserve Bank of San Francisco.
Doris Wilson is a research associate in the Economic Research Department of the Federal Reserve Bank of San Francisco.
References
Hale, Galina, and Bart Hobijn. 2011. “The U.S. Content of “Made in China.” FRBSF Economic Letter 2011-25 (August 8).
Kish, Matthew. 2014. “The Cost Breakdown of a $100 Pair of Sneakers.” Portland Business Journal, December 19.
National Highway Traffic Safety Administration. 2017. “Part 583 American Automobile Labeling Act Reports.”
Parilla, Joseph. 2017. “How U.S. States Rely on the NAFTA Supply Chain.” Brookings, The Avenue.
United States International Trade Commission. 2017. “Intermediate Goods Imports in Key Manufacturing Sectors.”
Xing, Yuqing, and Neal Detert. 2010. “How the iPhone Widens the United States Trade Deficit with the People’s Republic of China.” Asian Development Bank Working Paper 257.
Opinions expressed in FRBSF Economic Letter do not necessarily reflect the views of the management of the Federal Reserve Bank of San Francisco or of the Board of Governors of the Federal Reserve System. This publication is edited by Anita Todd and Karen Barnes. Permission to reprint portions of articles or whole articles must be obtained in writing. Please send editorial comments and requests for reprint permission to research.library@sf.frb.org