

A hot economy eventually boosts inflation. Such is the simple wisdom of the Phillips curve. Yet inflation across developed countries has been remarkably weak since the 2008 global financial crisis, even though unemployment rates are near historical lows. What is behind this recent disconnect between inflation and unemployment? Contrasting the experiences of developed and developing economies before and after the financial crisis shows that broader factors than monetary policy are at play. Inflation has declined globally, and this trend preceded the financial crisis.
The world economies have mostly recovered from the 2008 financial crisis. In the United States, United Kingdom, and Germany, for example, the unemployment rate is now below 4%, lower than it has been in decades. Tight labor markets are usually a symptom of a healthy economy and thus a rising demand for goods and services. To satisfy such demand, businesses usually raise prices—the basic mechanism underlying the standard economic relationship known as the Phillips curve. Yet, 10 years after the financial crisis, inflation has held remarkably steady. Some researchers therefore argue that the Phillips curve is no longer a useful descriptor of inflation dynamics (Coibion and Gorodnichenko 2015).
In this Economic Letter, we investigate whether the financial crisis has changed the long-standing inner workings of the Phillips curve. We extend the analysis in our previous Economic Letter (Jordà et al. 2019) to include developing economies and analyze three components of the Phillips curve to assess where the links appear to be broken.
Our analysis suggests that news of the death of the Phillips curve in developed economies appears premature. Fluctuations in labor market conditions have been largely offset with appropriate interest rate changes by central banks. Under such conditions, the influence of past inflation has faded, and expectations for future inflation have gravitated toward the central bank’s stated target. On the surface, inflation appears stable at all levels of labor market slack, and the Phillips curve link appears broken. Underneath, however, the Phillips curve could still be at work. The inflation dynamics that we observe could also be explained by a central bank that successfully offsets fluctuations in slack to keep inflation at the target. In less developed economies, central banks often operate under constraints that prevent full monetary policy offsets, which has given a bigger role to feedback from past inflation. That said, inflation has been trending down for the past two decades across developed and developing economies alike. The inevitable conclusion is that there are global forces putting downward pressure on inflation, and it is not just the result of better monetary policy.
What drives inflation?
To assess how well the Phillips curve explains inflation, we treat the financial crisis as a quasi-natural experiment. Because the crisis was mostly unexpected, we can use the time before the crisis as the control or baseline for the Phillips curve relationship to examine what happened after the crisis.
We estimate a Phillips curve model that explains inflation as a function of three components. First, we measure the demand-pull factors, using slack in the labor market. Specifically, we use the unemployment gap, which is the gap between the unemployment rate and its natural rate, or the rate at which prices would remain stable. The unemployment gap is a common proxy measure for aggregate demand conditions because higher demand usually means more hiring.
Second, we use feedback from past inflation, which we measure with the headline consumer price index (CPI) inflation. This acknowledges that prices tend to adjust slowly, so where inflation has been can influence where it is headed. That is, businesses take some of their pricing cues from previous periods, therefore making inflation persistent.
Third, we include expectations of future inflation based on survey data for the United States and data provided by the Organisation for Economic Co-operation and Development (OECD) for all other countries. If the central bank can credibly commit to an inflation target, then businesses will choose to price their products in a manner consistent with the stated target. In such a setting, fluctuations in the unemployment gap and past deviations of inflation from its target have a much more muted effect on actual inflation. Credibility is therefore a precious commodity.
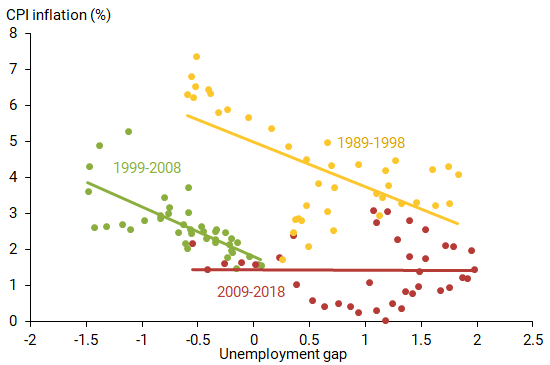
In the decade since the global financial crisis, the relationship between the unemployment gap and inflation appears to have weakened, as shown in Figure 1. Each point in Figure 1 represents the average of the unemployment gap, along the horizontal axis, and headline CPI inflation, on the vertical axis, across all OECD countries for a particular quarter. In the two decades before the crisis, there was a clear negative relationship between unemployment and inflation (yellow and green lines), such that when unemployment was high, inflation was low, and vice versa. The current decade (red line) shows that relationship has all but disappeared. Even with the unemployment gap below zero—meaning that on average the unemployment rate is lower than its natural rate—inflation averages around or below 2%.
Figure 1
Phillips curve across OECD countries by decade
However, Figure 1 provides only a simple correlation. Our next step is to formally estimate how each component of the Phillips curve—slack, persistence, and expectations—contributes to inflation, and how those contributions changed around the decade before and after the global financial crisis.
What is new since the global financial crisis?
We move beyond simple correlations and formally estimate the contribution of each of the three components of the Phillips curve: the unemployment gap, to measure slack; past inflation, to measure persistence; and inflation expectations. We also remove variation in inflation due to fluctuations in oil prices; this accounts for the fact that oil prices represent a classic supply factor that is outside the control of the monetary authority. We focus first on OECD economies that experienced the financial crisis. Figure 2 summarizes estimates for each of these components over two periods, before and after the financial crisis.
Figure 2
Contributors to Phillips curve changes: OECD countries
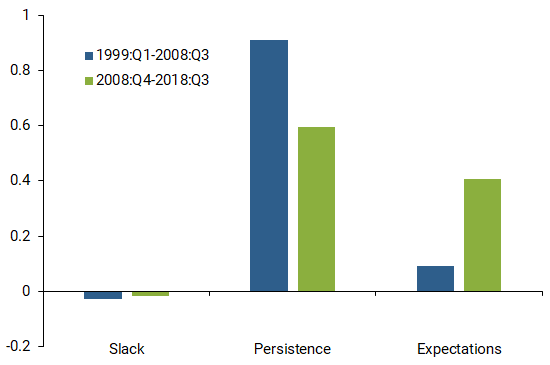
The first pair of bars in the figure shows the slack component. The bars are negative because more slack means lower inflation, thus subtracting from the total. Although the contribution of slack has dissipated since the crisis, it is clear that slack played a small role in explaining inflation dynamics before the crisis. Given the magnitude of our estimates, even large values of the unemployment gap would have only a small effect on total inflation.
The second and third pairs of bars refer to persistence and expectations components, respectively. Since the crisis, the estimate of the persistence term has declined by as much as the estimate of the expectations term has increased. Less persistence means that a perturbation to inflation today feeds into tomorrow’s inflation to a lesser degree. The increase in the estimate of the expectations term means that consumers are likely to dismiss such perturbations as transitory. In our previous Letter, we documented a similar pattern in the United States and argued that well-anchored expectations are a natural consequence of credible monetary policy.
Non-OECD countries and non-crisis trends
Even before the financial crisis, several other global trends were taking shape that probably affected global inflation. As a starting point for assessing the influence of these trends, Figure 3 displays average inflation across countries since 1998, divided into OECD developed economies and a sample of 23 non-OECD developing economies.
Figure 3
Average consumer price index inflation
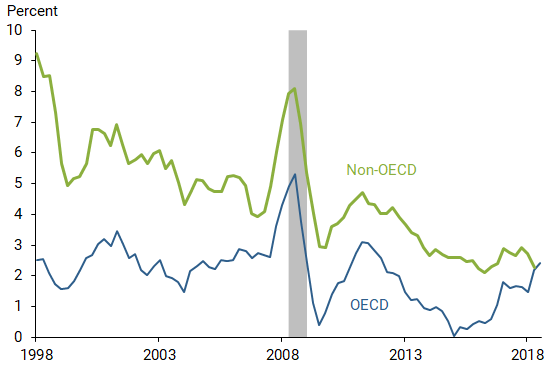
Figure 3 indicates that inflation for developing and developed economies has gradually converged over the years. By the end of the sample, average inflation in both groups was virtually the same. In part, the decline observed in developing economies may reflect increased credibility of central bank policies. However, both groups of economies share a common trend in inflation, suggesting that global factors may be keeping inflation at bay everywhere.
To better understand what might be happening globally, we repeat our estimation of the Phillips curve with the three components using the sample of 23 non-OECD developing economies in the decade before and after the global financial crisis. Figure 4 summarizes the results.
Figure 4
Contributors to Phillips curve changes: Non-OECD countries
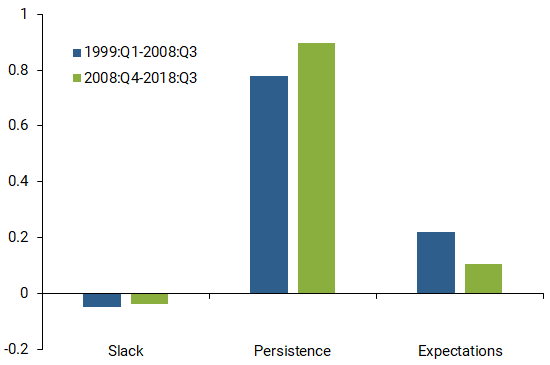
The first pair of bars shows that the unemployment gap exerted as little influence on inflation in developing economies as it did in developed economies. The persistence and expectations terms are more interesting. In contrast with what happened in developed economies, the persistence term was much larger and, if anything, has increased since the crisis. That is, perturbations in inflation today tend to play a larger role in how inflation will develop in the future. Also, the effects of expectations in developing economies have diminished to a larger degree relative to their developed peers as well as relative to the decade leading up to the crisis.
Since the three components of inflation reflect different experiences among developed and developing countries after the crisis, those elements cannot explain the global decline in inflation being low globally. Rather, the answer appears to lie in some other common underlying factors, which could be related to increasing trade openness, global supply chains, and greater capital and investment flows across countries. Such factors began reducing costs of production and investments and putting downward pressure on prices around the globe even before the crisis (International Monetary Fund 2006).
Conclusion
The global financial crisis upended our understanding of inflation dynamics, particularly when viewed through the lens of the Phillips curve. Low inflation has persisted despite very low unemployment in developed countries. Yet something similar has taken place in some non-OECD developing countries: despite the fact that nearly all of these countries have escaped the financial crisis, inflation has remained low there as well. Interestingly, for developing economies, the role of past inflation in explaining current inflation remains dominant, in contrast to the pattern among more advanced economies. However, because all countries have experienced a similar decline in inflation, other global factors must have played an important role in recent subdued inflation.
Òscar Jordà is vice president in the Economic Research Department of the Federal Reserve Bank of San Francisco.
Chitra Marti is a research associate in the Economic Research Department of the Federal Reserve Bank of San Francisco.
Fernanda Nechio is deputy governor in International Affairs and Corporate Risk Management with the Central Bank of Brazil.
Eric Tallman is a research associate in the Economic Research Department of the Federal Reserve Bank of San Francisco.
The views expressed do not necessarily reflect the views of the Central Bank of Brazil, the Federal Reserve Bank of San Francisco, or the Federal Reserve System.
References
Coibion, Olivier, and Yuriy Gorodnichenko. 2015. “Is the Phillips Curve Alive and Well After All? Inflation Expectations and the Missing Deflation.” American Economic Journal: Macroeconomics 7(1), pp. 197–232.
International Monetary Fund. 2006. “How Has Globalization Affected Inflation?” Chapter III in World Economic Outlook, April.
Jordà, Òscar, Chitra Marti, Fernanda Nechio, and Eric Tallman. 2019. “Inflation: Stress-Testing the Phillips Curve.” FRBSF Economic Letter 2019-05 (February 11).
Opinions expressed in FRBSF Economic Letter do not necessarily reflect the views of the management of the Federal Reserve Bank of San Francisco or of the Board of Governors of the Federal Reserve System. This publication is edited by Anita Todd and Karen Barnes. Permission to reprint portions of articles or whole articles must be obtained in writing. Please send editorial comments and requests for reprint permission to research.library@sf.frb.org