
Applications to start new businesses tanked from mid-March through May, contracting more severely than during the 2008–2009 financial crisis. Since then, however, applications have recovered so strongly that the total number filed in 2020 should be similar to that for 2019, even if applications growth reverts to the average lows experienced during the early days of the pandemic. This should result in only a modest loss of new businesses and is not likely to cause much additional strain on overall jobs and productivity gains.
The coronavirus disease 2019 (COVID-19) pandemic has forced many businesses across the United States to shutter, with many still unable to resume normal operations. Applications to start a business suggest that the pandemic also hit nascent businesses particularly hard. This is a potential concern because new and young businesses are an important source of job creation and innovation (see, for example, Haltiwanger, Jarmin, and Miranda 2013 and Klenow and Li 2020). In addition, their contribution to job growth is particularly important during economic recoveries (Laderman and Leduc 2013). To gauge the extent of the problem, this Economic Letter uses high-frequency data on business applications to estimate how much a potential decline in new businesses that hire workers would affect future loss of employment and productivity growth. We find that, even if the recovery of business applications were to stall in the coming months, the number of businesses applications in 2020 will be similar to that in 2019. Thus, declines in business formation may not add significantly to the already dire economic conditions during the pandemic.
Decline in business applications
We analyze data from the U.S. Census Bureau’s Weekly Business Formation Statistics. This new data set released in April 2020 covers business applications from 2006 to the present. The latest data at the time of this writing covers the week ending August 15, 2020. The Internal Revenue Service requires all potential U.S. business owners to apply for a unique Employer Identification Number (EIN), which they use to file taxes, pay workers, and apply for loans. The Census Bureau uses EINs to track the number of business applications and the business activities associated with each application over time. We focus on a subset of applications with characteristics such as corporate legal status or planned dates for the first payroll. The Census Bureau classifies these as high-propensity business applications (henceforth applications) because they are more likely to become actual new employers.
We use year-over-year growth in weekly applications to gauge the condition of nascent businesses during COVID-19. The year-over-year growth rate of applications for any week is the percentage change in applications from the same week of the previous year. For example, a growth rate of 10% for week 1 of 2020 means the number of applications in the first week of 2020 is 10% higher than applications in the first week of 2019. Figure 1 plots the growth in applications received each week from mid-January through mid-August; we compare 2019 (green line) and 2020 (blue line) to control for seasonal movements and holidays.
Figure 1
Growth of weekly high-propensity business applications
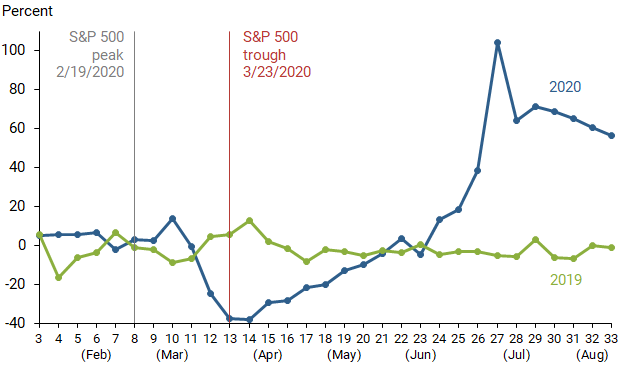
Note: Year-over-year growth rate, numbered by week.
Source: Weekly Business Formation Statistics, S&P 500 closing values.
Weekly applications in 2019 fluctuated around 0% with maximum deviations of –15% and 15%. Such week-to-week fluctuations are typical in this data set. Similar to 2019, applications growth in February 2020 also fluctuated around 0%. However, weeks 12 and 13 around the end of March saw applications plummet nearly 40% year-over-year. The timing of the decline coincides with the sharp drop in individuals’ mobility and consumer spending across much of the country (Wilson 2020), following the first shelter-in-place orders and widespread news of the pandemic. Applications steadily increased after mid-April, rising well above 2019 levels. Applications growth relative to 2019 peaked above 100% in week 27 and has declined to around 60% in recent weeks. The beginning of the recovery coincided with the recovery of the Standard & Poor’s (S&P) 500 stock index from its trough at the end of March (red vertical line).
On impact, COVID-19 created a crater in business applications: cumulative applications from mid-March to the end of May, weeks 12–22, fell 21% below the same period in 2019. To put this 11-week crater in perspective, we compare it to the worst 11-week span of applications during the Great Recession, May 25 to August 9, 2008, when cumulative applications were 19% below the same period in 2007. Thus, the severe drop in applications in spring 2020 was worse than during the depths of the Great Recession. However, recent stellar growth of business applications has more than made up for the earlier crater. Cumulative applications so far in 2020 are 8% higher than in 2019, compared with typical year-over-year growth of 4%. The strong rebound could reflect reallocation of business activities towards those with higher demand during the pandemic or an easing of the economic uncertainty. However, that recovery could be cut short if the number of COVID-19 cases suddenly rises and halts economic reopenings around the country.
What do applications data signal for new employer formation?
Because starting a business is risky, not all applications launch successfully to become actual businesses. To see how well applications predict growth of actual businesses—especially those with employees, as opposed to sole proprietorships—we count the number of employers formed each year in the Business Dynamics Statistics data from the Census Bureau. For 2007 to 2016, when both applications and employer data are available, we do a statistical comparison of the relationship between the two, regressing the annual growth rate of new employers on the annual growth rate of business applications in the previous year. We find a very strong, nearly one-to-one relationship: a 1% decrease in applications predicts a 1% decrease in new employers the following year.
Figure 2 shows that our predicted growth rate tracks the actual growth rate of new employers quite closely. In fact, growth in applications can explain approximately 88% of the annual variation in new employer growth. Hence, if applications in the summer and fall of 2020 were not able to make up for the severe contraction over the spring, it would signal a severe contraction in new employers in 2021.
Figure 2
Predicted versus actual growth rate of new employers
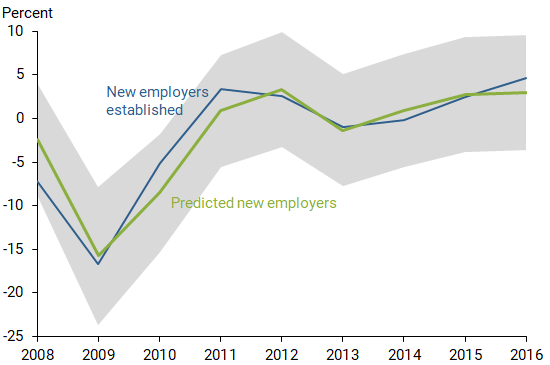
Note: Gray area represents 95% prediction interval.
Source: Weekly Business Formation Statistics, Business Dynamics Statistics.
Recovery scenarios
The impact of COVID-19 on new employer formation in 2021 will depend on what happens with the economy over the rest of 2020. We consider two scenarios for business applications growth. First, we consider a “full recovery” scenario, where the recent recovery in applications lasts long enough to make up for all those lost in the spring. This may happen if economic conditions and governmental policy encourage potential business owners that did not start in March and April to start a business later in the year. This scenario could be achieved if weekly applications for the rest of the year remain above 2019 levels.
In a second, pessimistic scenario, “faltering recovery,” applications growth drops to the average rate from weeks 12–22 and stays there until the end of 2020. In this scenario, applications contract severely by 21% for the rest of the year. For comparison, the number of applications received annually in 2008 declined 16% relative to 2007. Even though the scenario is quite pessimistic, the total number of applications would be only 2.7% lower than the optimistic scenario because of the stellar growth of applications in July and August. Since the number of new employers in the following year changes one-for-one with applications, this shortfall in applications would imply a similar impact on new employers in 2021, estimating 482,000 employer start-ups in 2021 compared with an estimated 496,000 in the optimistic scenario.
Employment and growth implications
Fewer new employers could significantly reduce aggregate employment and productivity growth in the U.S. economy, because new and young employers contribute disproportionately to creating jobs and improving the economy’s productivity. Garcia-Macia, Hsieh, and Klenow (2019), for example, estimate that nearly half of all job creation occurs within five years of an employer’s start-up, and newly formed employers account for one-third of overall job creation. Similarly, Klenow and Li (2020) find that new employers contributed one-third of total productivity growth between 1982 and 2013.
Thus, we shift our focus to analyze how a decline in new employers would affect employment and growth. For employment, the average number of workers at new employers has been quite stable around six since 1977, ranging from 5.4 in 1978 to 6.7 in 1982. Using the average employment among new employers in 2016, the latest year of data available, we can estimate the job loss associated with the drop in new employer growth under the faltering recovery scenario. We find that this scenario would result in around 86,700 fewer jobs in 2021 than in the full recovery scenario.
The estimated losses from fewer start-ups are equivalent to 0.1% of total U.S. nonfarm private-sector employment in 2019. While this is an economically large number of jobs lost, it does not add significantly to the severe job losses incurred thus far in the current crisis. However, because research has shown that a substantial portion of job growth is attributable to younger, dynamic firms—that is, the new firms from prior years that survived—the real employment cost may be felt down the road, when the jobs that would have been created by those businesses never materialize. This could restrain the recovery from the COVID-19 downturn in the years ahead, similar to findings in Laderman and Leduc (2014) that the decline in new employers contributed to the slow employment recovery during the Great Recession.
Turning to the effect on productivity growth, the faltering recovery scenario has 3% fewer new employers than the full recovery scenario. Klenow and Li (2020) estimate that new employers account for one-third of U.S. total factor productivity growth, a broad measure of productivity that controls for use of capital as well as labor. Assuming this average relationship continues to hold, the decline in new employers implies that productivity growth in the faltering recovery scenario would be 1% lower than the full recovery scenario. That is, if baseline productivity growth were 0.5% per year in the optimistic scenario (see, for example, Fernald and Li 2019), COVID-19’s effects on business start-ups would cause a further reduction of 2021 productivity growth by less than half a basis point, or 0.005 percentage point. This drag on productivity growth is modest because applications rebounded so strongly in July and August that the number of new employers would not decline significantly, even if applications growth reverted to the earlier lows.
Conclusion
The sharp drop in new business applications this spring could have signaled an even larger problem for future economic recovery from the pandemic because of the important role new businesses play in job creation and productivity growth. Although growth in business applications has strongly recovered in recent months, it is important to consider the potential impact if applications were to contract again. This Letter finds that the strength of the rebound in July and August appears to have erased much of the initial damage to business applications associated with COVID-19. Even if business applications reverted to the lows from this spring, the historical relationship between applications and new business formation suggests only a 3% decline in new employers for 2020. Since the economic conditions are already very severe, this decline in new employers would not significantly affect the near-term outlook of the labor market and the economy.
Huiyu Li is a senior economist in the Economic Research Department of the Federal Reserve Bank of San Francisco.
Mitchell G. Ochse is a research associate in the Economic Research Department of the Federal Reserve Bank of San Francisco.
References
Fernald, John, and Huiyu Li. 2019. “Is Slow Still the New Normal for GDP Growth?” FRBSF Economic Letter 2019-17 (June 24).
Garcia‐Macia, Daniel, Chang‐Tai Hsieh, and Peter J. Klenow. 2019. “How Destructive Is Innovation?” Econometrica 87(5), pp. 1,507–1,541.
Haltiwanger, John, Ron S. Jarmin, and Javier Miranda. 2013. “Who Creates Jobs? Small versus Large versus Young.” Review of Economics and Statistics 95(2), pp. 347–361.
Klenow, Peter, and Huiyu Li. 2020. “Innovative Growth Accounting.” Forthcoming in NBER Macroeconomics Annual 2020, Volume 35.
Laderman, Liz, and Sylvain Leduc. 2014. “Slow Business Start-ups and the Job Recovery.” FRBSF Economic Letter 2014-20 (July 7).
Wilson, Daniel J. 2020. “Weather, Social Distancing, and the Spread of COVID-19.” FRB San Francisco Working Paper 2020-23.
Opinions expressed in FRBSF Economic Letter do not necessarily reflect the views of the management of the Federal Reserve Bank of San Francisco or of the Board of Governors of the Federal Reserve System. This publication is edited by Anita Todd and Karen Barnes. Permission to reprint portions of articles or whole articles must be obtained in writing. Please send editorial comments and requests for reprint permission to research.library@sf.frb.org