
Despite a sharp spike in unemployment since March 2020, aggregate wage growth has accelerated. This acceleration has been almost entirely attributable to job losses among low-wage workers. Wage growth for those who remain employed has been flat. This pattern is not unique to COVID-19 but is more profound now than in previous recessions. This means that, in the wake of the virus, evaluations of the labor market must rely on a dashboard of indicators, rather than any single measure, to paint a complete picture of the losses and the recovery.
Median usual weekly earnings and other aggregate measures of wage growth can be useful tools for analyzing how the average worker is progressing economically. But sometimes readings of these measures can give false signals. This is because factors other than increases or decreases in wages paid to individuals can influence whether median earnings rise or fall. The current economy is a perfect example. Recent data show that median usual weekly earnings of full-time workers have grown 10.4% over the four quarters preceding the second quarter of 2020. This is a 6.4 percentage point acceleration compared with the fourth quarter of 2019. The median usual weekly earnings measure that we focus on here is not an exception. Other measures of wage growth—like average hourly earnings and compensation per hour—show similar spikes.
In this Economic Letter, we dig deeper into the data and show that this spike in wage growth primarily reflects the departure of low-wage workers who have been laid off due to coronavirus disease 2019 (COVID-19) and are no longer counted in the aggregate wage series. We then describe how such movements muddy the signals being sent by these measures. Focusing on the recent data on wage growth, we demonstrate that they reflect an illusion of labor market strength and cannot be used as evidence that the labor market has withstood the COVID-19 shock well.
Makings of an illusion
To get a better sense of how aggregate wage data can be affected by changes in the composition of the workforce—that is, who is working and who isn’t—consider the following example. In 2018, a small restaurant owner employed three people, herself and two servers. The owner paid herself $75,000 and each employee $27,000 annually. This means that average annual earnings at the restaurant were $43,000 a year in 2018. When COVID-19 hit in March 2020, the owner moved to take-out only and laid off both servers. As a result, average annual earnings at the restaurant increased from $43,000 to $75,000.
This restaurant is not unique. Such changes regularly happen throughout the U.S. labor market and have been especially prevalent in recent months as the response to COVID-19 has reverberated across the economy.
So what can we do to account for these changes and make sure that the signals we’re getting about the strength of the labor market are more than an illusion? Research by Daly and Hobijn (2016) provides a useful method. We break aggregate wage growth into two parts: an intensive margin, which captures wage growth among individuals who remain employed; and an extensive margin, which captures the impact of workers entering and exiting employment. In the restaurant example, the intensive margin is made up of the wage growth of the owner of the restaurant who was continuously employed. The extensive margin captures the change in aggregate wage growth due to the servers moving from being employed to being unemployed.
As COVID-19 and the actions taken to combat it have pushed many low-wage workers into unemployment, the extensive margin has been playing a larger role in aggregate wage growth, causing it to accelerate even as paychecks remain flat.
Disproportionate job losses and aggregate wage growth
COVID-19 has taken a tremendous toll on the U.S. labor market. Figure 1 illustrates the magnitude of the damage. The figure plots the share of full-time workers exiting to nonemployment, either unemployment or nonparticipation, each month over the past two decades.
Figure 1
Share of worker exits to unemployment and nonparticipation
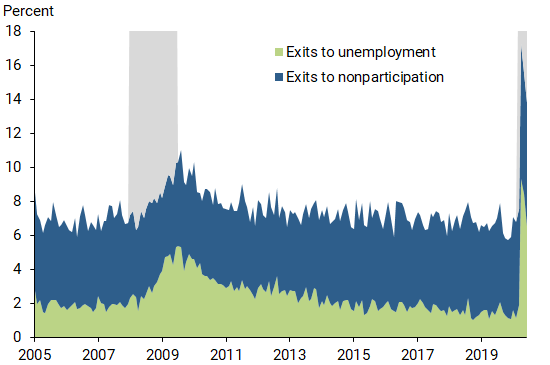
Note: Gray areas indicate NBER recession dates.
In normal nonrecessionary times, about 7% of those with full-time jobs move into unemployment (2%) or leave the labor force (5%) each year.
During the Great Recession and its aftermath, nonemployment peaked in August 2009 at 11%. Most of the increase was due to exits to unemployment, which went up 3 percentage points. There was little movement in the rate at which workers exited to nonparticipation.
The onset of COVID-19 has been a substantially larger shock. Since March 2020, the share of workers exiting full-time employment has risen dramatically. As Figure 1 shows, exits from full-time employment to nonemployment peaked in May 2020 at 17%, with 9% moving to unemployment and 8% to nonparticipation. This is almost twice as high as during the depth of the Great Recession.
A notable difference from the Great Recession is the marked spike in exits to nonparticipation, which indicates that many workers are lining up on the fringe of the labor market and are not classified as unemployed.
Since May 2020, exits to nonemployment have slowed, with the rate falling to about 14%. Though a decline in these flows is good news, the elevated level of the flows is indicative of continued severe disruptions in the labor market.
Job loss disproportionate among low-income workers
Since the onset of COVID-19, low-wage workers have been disproportionately affected by job loss. That is, a disproportionate share of those who lost jobs came from the bottom half of the wage distribution.
Figure 2 plots the share of workers exiting full-time employment by position in the wage distribution. Moving up from the bottom axis, the three areas in the figure depict the exits among workers in the lowest quarter of the earnings distribution, the second lowest quarter, and the top half, respectively.
Figure 2
Share of worker exits to nonemployment by earnings
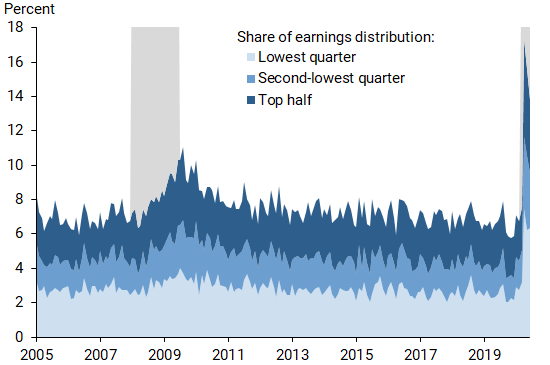
Note: Gray areas indicate NBER recession dates.
The data show that, historically, exits from full-time employment have disproportionately come from the lower end of the earnings distribution. The current spike in exits shown in Figures 1 and 2 has not reversed this trend. In the months following the onset of COVID-19, workers in the bottom 25% of the earnings distribution made up about half of the exits to nonemployment. In contrast, the top half of the distribution only accounted for about a third of the exits.
Overall, the unusually high shares of workers exiting to unemployment and to nonparticipation—in combination with those exits disproportionately coming from low-wage workers—is pushing up aggregate wage growth.
Clarifying the signal on wage growth
We have shown that understanding how the movements into and out of full-time employment affect aggregate wage growth statistics is essential to getting a clear signal on the strength of the U.S. labor market. So what can be done to measure wage growth when so many workers are losing jobs and exiting employment?
One simple way is to compare the official published measure of wage growth, which has been affected by the exits we documented, with one for workers who maintain full-time employment over the entire period. The latter measure keeps the composition of workers constant.
The recent disparity between these two statistics, plotted in Figure 3, illustrates why such a comparison is useful. In the second quarter of 2020, the published four-quarter growth rate of nominal median usual weekly earnings (blue line) spiked at 10.4%. This is almost 8 percentage points higher than the growth rate of earnings for workers who had been employed full-time throughout the past year (green line).
Figure 3
Growth in median usual weekly earnings
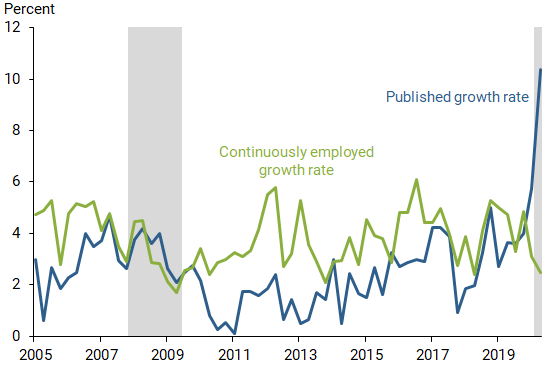
Note: Gray areas indicate NBER recession dates.
Furthermore, examining the recent trends in these two measures yields opposite conclusions. Since the last quarter of 2019, the aggregate growth rate of median earnings has accelerated by 6.4 percentage points. In contrast, wage growth for continuously employed workers has slowed by 2.4 percentage points since the end of 2019.
Therefore, the recent spike in aggregate nominal wage growth does not reflect the benefits of pay raises and a strong labor market for workers. Instead, it is the result of the high levels of job loss among low-income workers since the start of the pandemic.
This stark impact of exits from employment on median wages is not specific to the published headline measure of median usual weekly earnings for full-time workers that we focus on here. Cajner et al. (2020) document similar facts for administrative payroll data from ADP. They estimate that exits from employment since COVID-19 have raised average wages by 5%. Other headline measures of wage growth, such as average hourly earnings and compensation per hour, also have been pushed up by the recent movements along the extensive margin.
A notable exception is the employment cost index from the Bureau of Labor Statistics, which measures wage growth for a fixed set of jobs. It points to a slowdown in wage growth, similar to our series for the continuously full-time employed in Figure 3.
It is important to realize that what goes up must come down. While the recent job losses of low-wage workers has pushed up wage growth during the onset of the COVID-19 crisis, their job gains during the recovery will instead be a drag on aggregate wage growth. Thus, many standard earnings growth measures will understate the reduction in labor market slack when the economy recovers.
Conclusion
Recent job losses due to the COVID-19 pandemic have distorted measures of aggregate wage growth upwards by several percentage points. Therefore, high wage growth captured in aggregate measures should not be seen as indicative of a recovering or a strong labor market. Furthermore, because the current economic disruption differs in character from the Great Recession—most notably in terms of workers exiting to nonparticipation—predictions about the future state of the economy and labor market recovery based on models of the Great Recession must account for these differences.
Erin E. Crust is a student at Barrett Honors College, Arizona State University.
Mary C. Daly is chief executive officer and president of the Federal Reserve Bank of San Francisco.
Bart Hobijn is professor of economics at the W.P. Carey School of Business, Arizona State University, and a visiting scholar at the Federal Reserve Bank of San Francisco.
References
Cajner, Tomaz, Leland D. Crane, Ryan A. Decker, John Grigsby, Adrian Hamins-Puertolas, Erik Hurst, Christopher
Kurz, and Ahu Yildirmaz. 2020. “The U.S. Labor Market during the Beginning of the Pandemic Recession.” Brookings Papers on Economic Activity, conference draft, June 25.
Daly, Mary C., and Bart Hobijn. 2016. “The Intensive and Extensive Margins of Real Wage Adjustment.” FRB San Francisco Working Paper 2016-04.
Opinions expressed in FRBSF Economic Letter do not necessarily reflect the views of the management of the Federal Reserve Bank of San Francisco or of the Board of Governors of the Federal Reserve System. This publication is edited by Anita Todd and Karen Barnes. Permission to reprint portions of articles or whole articles must be obtained in writing. Please send editorial comments and requests for reprint permission to research.library@sf.frb.org