
In times of economic turbulence, revisions to GDP data can be sizable, which makes conducting economic policy in real time during a crisis more difficult. A simple model based on Okun’s law can help refine the advance data release of real GDP growth to provide an improved reading of economic activity in real time. Applying this to data from the Great Recession explains some of the massive GDP revisions at that time. This could provide a guide for possible revisions to GDP releases during the current coronavirus crisis.
Economic data are not data in the traditional sense. Unlike physical phenomena, which can be determined with great accuracy, measuring economic activity is a highly complex process that aggregates data from different sources and surveys. Thus, the advance release of U.S. GDP growth—the first available public release of GDP data for a given quarter from the Bureau of Economic Analysis (BEA)—relies on incomplete reports and sophisticated statistical methods to fill in missing information. Over time, that missing information is replaced with hard numbers as they gradually come in. This fog of numbers only gets thicker in times of economic distress.
The May 2020 unemployment rate is a case in point. The Bureau of Labor Statistics reported the unemployment rate as 13.3%. However, subsequent reports of classification errors—when a large proportion of workers that were employed but absent from work were not counted as unemployed—could end up boosting the unemployment rate to around 16–17%. This illustrates the fraught nature of economic statistics in the midst of a crisis.
Forecasts for the second quarter of 2020 currently point to an implosion of real GDP by around 30–40% at an annual rate, depending on the economic forecasting bureau. By any measure, this would be an unprecedented decline. The advance release is expected to be made public on July 30. Given what happened with the unemployment rate, how can we best calibrate our views on the state of the economy? In this Economic Letter we draw on the link between the unemployment rate and real GDP growth, known as Okun’s law, to get a better sense of the underlying value of GDP growth in real time.
GDP revisions were large in the Great Recession
During the Great Recession, the advance releases of GDP sometimes bore little relation to the numbers that now appear in the official record. Figure 1 shows the GDP revisions, calculated as the most recently available data minus the BEA initial release, for the period between the fourth quarter of 2006 and the second quarter of 2009. The Great Recession is shaded in gray. The figure shows that the decline in real GDP growth initially seemed far less serious than it turned out to be. In fact, for the first half of 2008, the data would have been consistent with only a relatively mild recession. But by the fourth quarter of 2008, the quarterly contraction was initially listed at –3.8% annual rate. With the passing of time, the data were revised down another whopping –4.6 percentage points, thus bringing the decline in GDP to an eye-watering –8.4% annual rate. Policymakers understood the gravity of the situation in real time, but the real extent of the problem did not become clear until years afterward. In hindsight, had officials known the actual depth of the recession in real time, they might have voted for a larger fiscal stimulus package, for example.
Figure 1
Revisions of real GDP growth in the Great Recession
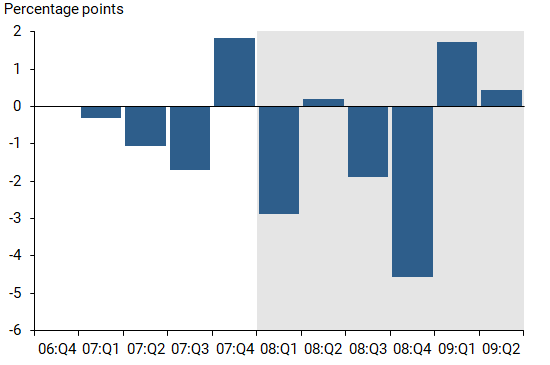
Note: Revisions are measured by the most recent data minus the initial release. Gray shading indicates NBER recession dates.
Are GDP revisions larger when the economy is in free fall?
Since the mid-1980s, fluctuations in GDP growth have become considerably milder, with the exception of the Great Recession. Not surprisingly, the BEA has also become more proficient at generating reliable estimates quickly. Thus, when the economy is stable, GDP data do not get revised by very much over time.
Large fluctuations in GDP growth are uncommon and happen most often in times of economic distress. During such times, the accounting and statistical procedures that are the basis for the advance estimates of real GDP growth become less reliable, as we will show. This is particularly an issue because about a third of the advance release GDP estimates are based on incomplete data and rely on assumptions and monthly trend extrapolations, particularly for information related to consumer spending on services.
The coronavirus disease 2019 (COVID-19) pandemic will likely affect the GDP advance release in at least two ways. First, the magnitude of the economic shutdown is unprecedented and is likely to modify the economy’s typical inner workings for a while—for example, by disrupting supply chains. Second, statistical agencies are likely to have a harder time collecting survey data and accounting for economic relationships accurately in the current environment. In this context, the revisions to the advance release of real GDP growth for the second quarter of this year could be particularly large.
Figure 2 depicts the dependence between the advance estimate of real GDP growth—measured on the horizontal axis—and its revisions—measured on the vertical axis. In general, the larger the advance estimate, the smaller the revision. However, the relationship is asymmetric: negative growth rates are, on average, followed by larger revisions, in absolute value. To visualize this asymmetry, negative growth rates are depicted by the red dots in the figure. The green circles correspond to nonnegative growth. Thus, the fit of the red line through the cloud of negative growth red dots provides evidence of a relationship that is mostly absent otherwise for the green circles. However, the data become more imprecise when we need them the most.
Figure 2
Revisions to negative versus nonnegative GDP growth
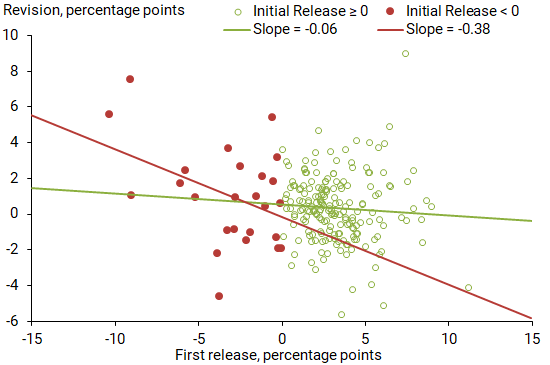
Note: Red dots indicate negative GDP growth initial release data. Green circles indicate nonnegative growth values.
Okun’s law to the rescue
What can be done to adjust the initial data, especially in economic downturns? We model revisions using a simple three-pronged strategy. First, we formalize the relationship between revisions and the magnitude and sign of the advance release. Second, we allow for potential seasonal factors related to GDP accounting practices. Third, we draw on the relationship between the unemployment rate and output growth, known in economics as Okun’s law (see, for example, Daly et al. 2014).
It is generally difficult to predict revisions in real time, partly because any information that one could use to predict revisions is also available to the statistical agencies that are mandated to produce such data. We find this holds true: there is limited scope to improve on the advance release—the BEA does its job very well. However, some economic relationships appear to hold true more precisely with revised data than with the advance release of real GDP growth. One such relationship is Okun’s law, which suggests that real GDP growth will decline about 2 percentage points for each percentage point increase in the unemployment rate.
Our model based on these three components contains useful guidelines for what may happen in the second quarter of 2020 and beyond. We find that changes in the unemployment rate amplify the revision. For every percentage point increase in the unemployment rate in a quarter, the model suggests that GDP growth will eventually be revised down by 1.7 percentage points. On the other hand, a 1 percentage point decline in the advance release of GDP growth is associated with a subsequent ½ percentage point increase of final GDP growth. Thus, these two components pull real GDP growth revisions in opposite directions. Why? The more the advance release of GDP growth diverges from what Okun’s law predicts, the more tension that exists between these two components. The revision will reflect this tension.
In addition, we find robust evidence of seasonality in the revisions. Second quarter revisions are typically positive, amounting to about 1 percentage point increase in the most current vintage of the data relative to the advance estimate. Although our model explains only 16% of the variation for all data revisions, its ability to explain the data more than doubles to about 35% when the advance estimate of real GDP growth is negative.
Figure 3 shows our model estimates of expected revisions to GDP growth for 2020 through the first quarter of 2021. The first blue dot shows the expected revision to real GDP growth in the first quarter of 2020, for which the advance BEA estimate is already available, so there is no disagreement about the prediction. The shaded green area shows the 90% historical prediction interval, with the green line indicating the historical median revision of 0.3 percentage points, based on data from the first quarter of 1992 to the fourth quarter of 2019. Using private-sector forecasts and our model, the blue shaded rectangles show the lowest 25%, 50% (median, blue dots) and 75% revisions predicted by our model. The dark blue error bars display the predicted maximum and minimum values.
Figure 3
Range of estimated revisions to real GDP growth
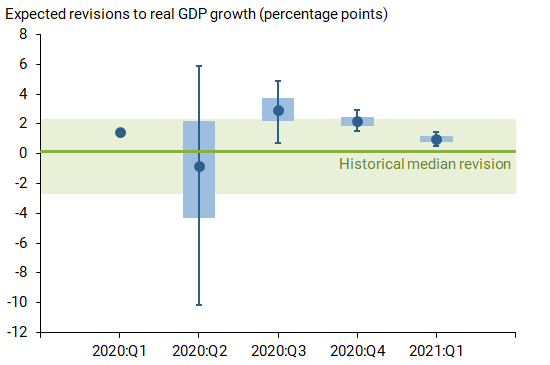
Note: We use the median, bottom and top 10 average forecasts from the June 2020 Blue Chip Economic Indicators survey to obtain the range of revisions. The green line and shaded region are the median and 90% range of historical revisions.
Not surprisingly, the figure suggests that there is enormous disagreement around the revisions expected for this year relative to the historical sample. For instance, we calculate the range of possible revisions to the second quarter data to be between –10 and 6 percentage points. The disagreement about the revisions to third quarter GDP growth is smaller relative to the previous quarter but still considerably larger than what the historical data suggest. By the end of the year, the disagreement about revisions falls more in line with historical observations.
Conclusion
GDP data are a critical barometer of economic activity. However, initial estimates of this statistic in real time are subsequently revised, sometimes many years later. In normal times, these revisions are generally small and inconsequential. In times of economic distress, such as we are currently experiencing, the revisions can be quite large and variable, further clouding measures of the economic outlook when they are most needed. Though revisions to what appears to be a catastrophic second quarter GDP number will matter little from a policy point of view, they could significantly change the picture once the economy starts to recover. For example, misjudging the speed of the recovery could mean that assistance is removed too soon. Given the difficulties in obtaining reliable statistics—as the release of the unemployment rate for May 2020 showed—it seems prudent to err on the side of caution.
Òscar Jordà is a senior policy advisor in the Economic Research Department of the Federal Reserve Bank of San Francisco.
Noah Kouchekinia is a research associate in the Economic Research Department of the Federal Reserve Bank of San Francisco.
Colton Merrill is a research associate in the Economic Research Department of the Federal Reserve Bank of San Francisco.
Tatevik Sekhposyan is a visiting fellow in the Economic Research Department of the Federal Reserve Bank of San Francisco.
Reference
Daly, Mary C., John G. Fernald, Òscar Jordà, and Fernanda Nechio. 2014. “Interpreting Deviations from Okun’s Law.” FRBSF Economic Letter 2014-12 (April 21).
Opinions expressed in FRBSF Economic Letter do not necessarily reflect the views of the management of the Federal Reserve Bank of San Francisco or of the Board of Governors of the Federal Reserve System. This publication is edited by Anita Todd and Karen Barnes. Permission to reprint portions of articles or whole articles must be obtained in writing. Please send editorial comments and requests for reprint permission to research.library@sf.frb.org