
The United States enacted a series of fiscal relief and stimulus bills in recent weeks, centered around the Coronavirus Aid, Relief, and Economic Security (CARES) Act. The current fiscal response shares key similarities to the fiscal stimulus enacted during the Great Recession. Research over the past 10 years on the macroeconomic impact of that stimulus thus has important implications for the current fiscal response. The results point to a large potential impact on GDP.
Since early March, the United States has enacted a series of fiscal policy actions in response to the outbreak and economic repercussions of coronavirus disease 2019 (COVID-19). In this Economic Letter, I analyze similarities between the current response and the fiscal stimulus during the Great Recession. Given the similarities, the past decade of research on the macroeconomic impact of the Great Recession fiscal stimulus has important implications for the potential impact of the COVID-19 fiscal response. Research suggests it will have a large effect on GDP over the next few years. The precise timing of its effect will depend on how quickly and extensively spending resumes on travel, leisure and hospitality, and other areas of consumption that are currently constrained by voluntary and government-imposed social distancing.
Federal fiscal policy responses to COVID-19
As of mid-May, there have been four phases of federal fiscal response. The first two focused on emergency health care, food assistance, Medicaid, and paid sick and family leave related to COVID-19. The third and by far largest phase was the Coronavirus Aid, Relief, and Economic Security (CARES) Act, initially estimated by the Congressional Budget Office (CBO 2020) to cost $1.7 trillion. The fourth phase increased funding for areas covered in prior phases, especially the Paycheck Protection Program (PPP), which funds small business loans that convert to grants if used primarily to maintain payrolls.
Taken together, the discretionary fiscal responses to COVID-19 are likely to add about $2.4 trillion, approximately 11.2% of 2019 GDP, to the federal deficit, occurring mainly over the next year. To put this in perspective, the 2019 deficit was $984 billion, 4.6% of GDP. This projected increase is separate from nondiscretionary deficit increases supporting preexisting “automatic stabilizer” programs such as Medicaid and the Supplemental Nutritional Assistance Program (SNAP), as more households become eligible, and from anticipated declines in federal tax revenue. In all, the increase in the federal primary deficit over the next year or so is virtually guaranteed to surpass anything seen in the United States since World War II.
The COVID-19 fiscal policy response to date consists of five broad components: (1) transfers to individuals, 23%; (2) government consumption through direct federal purchases of goods and services, 24%; (3) transfers to state and local governments, 12%; (4) grants and unrecovered loans to businesses, primarily the PPP, 29%; and (5) tax provisions, 11%. The percentages are shares of the total deficit cost based on CBO (2020).
Comparison to the Great Recession fiscal stimulus
How do the size and composition of the COVID-19 fiscal response compare to the Great Recession stimulus? During the Great Recession, the federal primary deficit rose from nearly -1% to nearly 8% as a share of GDP. That stemmed from the $840 billion American Recovery and Reinvestment Act (ARRA) of 2009 (CBO 2015) and $170 billion in tax rebates from the 2008 Economic Security Act, along with automatic stabilizers and reduced tax revenue. Thus, the discretionary stimulus during the Great Recession was about 7.5% of GDP, somewhat smaller than the COVID-19 response to date, at 11.2% of GDP.
The composition of the two fiscal stimulus programs is very similar except for the current PPP, which had no match in the Great Recession (Figure 1). Other important similarities are that both came during severe economic downturns and when the federal funds rate was near its zero lower bound (ZLB), which limits the ability of monetary policy to stimulate the economy.
Figure 1
Composition of fiscal responses
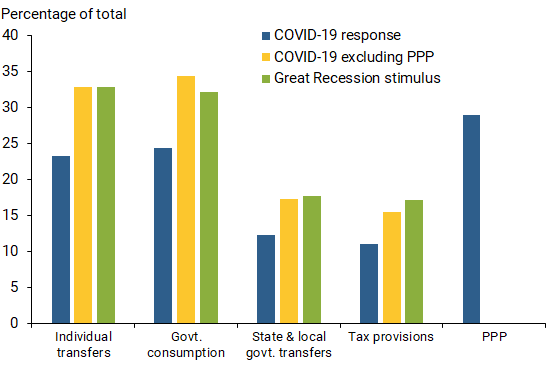
Note: Author’s calculations based on estimates in CBO (2015, 2020).
Evidence on the fiscal multiplier
The similarities between the current fiscal response and that during the Great Recession suggest that extensive research over the past decades related to the fiscal multiplier, particularly the multiplier on the key stimulus elements, could hold important lessons for current fiscal policy. The fiscal multiplier is a common metric used in macroeconomics to summarize the impact of fiscal spending or tax changes on GDP over a particular period. A multiplier of 1.0 implies $1 increase in GDP results from every $1 of stimulus.
I focus on the first three components of the COVID-19 fiscal response that are the most comparable to stimulus components enacted during the Great Recession and thus have the most potential benefits from research.
Individual transfers. Several influential studies have examined the effects of direct fiscal transfers to individuals, especially the tax rebates of 2008, on consumption. Studies of the macroeconomic impact of individual transfers typically estimate the “marginal propensity to consume” or MPC. This is the fraction of the extra dollar of aid that a person spends on consumption, with the remainder going into savings or to pay down debt. In a simple Keynesian model, the fiscal multiplier on transfers equals MPC/(1–MPC), so an MPC above 0.5 would imply a multiplier above 1. Traditional economic theory predicts a much smaller MPC, around 0.05, from a one-time influx of income such as a tax rebate. The small MPC is based on the logic that individuals smooth their consumption over their lifetimes, borrowing when income is low and saving when income is high, and will only spend out of a temporary income boost in proportion to its impact on lifetime income.
Two studies of the 2008 tax rebates (Parker, et al. 2013 and Sahm, Shapiro, and Slemrod 2010) found relatively large MPCs, around 0.25 overall and as high as 0.67 for “liquidity-constrained” households, which either are unable to borrow when income is low or have assets that are difficult to sell quickly.
This evidence suggests that the MPC during the current crisis could be quite high for many households, for example those experiencing layoffs, as they use transfer funds for basic needs such as food, housing, and utilities. However, many other households, for example employed or retired, may have an MPC closer to zero because many types of spending are less available due to social distancing. In general, the more severe and prolonged the economic downturn, the higher the share of households that will be liquidity constrained and the more households will need to use transfer income for basic needs, pushing up overall MPC.
Regarding individual transfers from enhanced unemployment insurance (UI) benefits in the CARES Act, the evidence above suggests a particularly high MPC given that unemployed individuals are likely to be liquidity constrained, or would be if not for the benefits. A recent paper by Ganong and Noel (2019) using individual bank account data found that spending by unemployed individuals drops sharply when UI benefits expire, suggesting that UI benefits have a large impact on consumption. Hence, the MPC and therefore the fiscal multiplier on UI benefits over the next year could be much higher than the average MPC on individual transfers.
Government consumption. Government purchases of goods and services is the canonical type of government spending analyzed in most empirical macroeconomic studies of the fiscal spending multiplier. The cross-geographical evidence on the fiscal multiplier for ARRA spending is especially pertinent for studying the COVID-19 fiscal stimulus for two reasons. First, ARRA funds were intended to be distributed quickly, much like recent stimulus. Second, the local fiscal multiplier is closely linked to the national fiscal multiplier for a closed economy at the ZLB (Chodorow-Reich 2019), which describes the current U.S. economy well.
Chodorow-Reich (2019) provides a useful overview of the literature on ARRA’s local employment multiplier and new evidence on its local GDP multiplier, which both point to a GDP multiplier of about 1.5. Other cross-geographical studies estimating the consumption effect of ARRA spending imply a multiplier around 1.5.
Studies of the national fiscal multiplier based on historical time series data, such as Ramey and Zubairy (2018), have tended to find multipliers below one. However, that study and Cloyne, Jordà, and Taylor (2020) found that the multiplier may be as high as 1.5 to 2.0 during ZLB periods, consistent with cross-geographical studies, which hold monetary policy constant by design. In addition, separate analyses of how the fiscal multiplier differs in recessions and expansions have generally found larger multipliers in recessions.
Transfers to state and local governments. An important issue for determining the multiplier on transfers to state and local governments is the “flypaper effect.” This refers to the portion of federal money state and local governments receive that they actually spend as opposed to saving or financing tax cuts. This is analogous to the MPC for individual transfers.
Leduc and Wilson (2017) found a very strong flypaper effect for ARRA federal highway transfers, with funds being spent dollar-for-dollar in the short run and even higher in the longer run. In the current situation, the flypaper effect also seems likely to be dollar-for-dollar given that most states anticipate severe budget shortfalls and nearly all states have balanced budget requirements, making them severely liquidity constrained. Put differently, in the current environment, it seems unlikely that states would use any of their federal transfer funds to finance tax cuts or pay down preexisting debt.
Putting these pieces together, the fiscal multiplier for the COVID-19 fiscal response is likely to be near or above 1. A multiplier of 1 would suggest that the COVID-19 stimulus to date—about 11% of GDP expected to be spent mostly over the next year—could increase GDP 11% or more over the next two to three years, allowing for lagged effects, relative to a scenario with no stimulus.
This large potential impact does not necessarily imply that actual GDP will grow strongly. Most estimates of COVID-19’s direct damage to GDP, not accounting for any fiscal response, are extremely large. Thus, even a large fiscal multiplier on a large fiscal stimulus may not be sufficient to avoid weak economic growth over the next few years.
Conclusion
The COVID-19 fiscal response has many key similarities to that during the Great Recession. Evidence from past fiscal stimulus yields three important implications. First, the marginal propensity to consume out of individual transfers is particularly high when unemployment is high and liquidity constraints bind, implying fiscal multipliers near or above one. Second, the marginal propensities to spend out of federal transfers by state and local governments are particularly high during times of fiscal strain, suggesting at least a dollar-for-dollar pass-through to spending. Third, the fiscal multiplier on government spending when monetary policy is by the zero lower bound is around 1.5. Overall, the evidence suggests that the output boost from the current fiscal response is likely to be large.
Daniel J. Wilson is vice president in the Economic Research Department of the Federal Reserve Bank of San Francisco.
References
Chodorow-Reich, Gabriel. 2019. “Geographic Cross-Sectional Fiscal Spending Multipliers: What Have We Learned?” American Economic Journal: Economic Policy 11(2), pp. 1–34.
Cloyne, James S., Òscar Jordà, and Alan M. Taylor. 2020. “Decomposing the Fiscal Multiplier.” NBER Working Paper 26939.
Congressional Budget Office. 2015. “Estimated Impact of the American Recovery and Reinvestment Act on Employment and Economic Output in 2014.” Report, February 20.
Congressional Budget Office. 2020. “H.R. 748, CARES Act, Public Law 116-136.”
Ganong, Peter, and Pascal Noel. 2019. “Consumer Spending during Unemployment: Positive and Normative Implications.” American Economic Review 109(7), pp. 2,383–2,424.
Leduc, Sylvain, and Daniel Wilson. 2017. “Are State Governments Roadblocks to Federal Stimulus? Evidence on the Flypaper Effect of Highway Grants in the 2009 Recovery Act.” American Economic Journal: Economic Policy 9(2), pp. 253–292.
Parker, Jonathan A., Nicholas S. Souleles, David S. Johnson, and Robert McClelland. 2013. “Consumer Spending and the Economic Stimulus Payments of 2008.” American Economic Review 103(6), pp. 2,530–2,553.
Ramey, Valerie A. and Sarah Zubairy. 2018. “Government Spending Multipliers in Good Times and in Bad: Evidence from U.S. Historical Data.” Journal of Political Economy 126(2), pp. 850–901.
Sahm, Claudia R., Matthew D. Shapiro, and Joel B. Slemrod. 2010. “Household Response to the 2008 Tax Rebate: Survey Evidence and Aggregate Implications.” Chapter 3 in NBER Book, Tax Policy and the Economy, vol. 24, ed. Jeffrey R. Brown. Chicago: University of Chicago Press, pp. 69-110.
Opinions expressed in FRBSF Economic Letter do not necessarily reflect the views of the management of the Federal Reserve Bank of San Francisco or of the Board of Governors of the Federal Reserve System. This publication is edited by Anita Todd and Karen Barnes. Permission to reprint portions of articles or whole articles must be obtained in writing. Please send editorial comments and requests for reprint permission to research.library@sf.frb.org