
Stay-at-home orders issued to slow the spread of COVID-19 may have severely distorted labor market statistics, notably the official unemployment rate. A method to correct the survey biases associated with the pandemic indicates that the true unemployment rate was substantially higher than the official rate in April and May. However, the biases appeared to fade thereafter, making the drop in June even more dramatic than implied by the official data.
As the economic fallout from the coronavirus disease 2019 (COVID-19) pandemic continues to unfold, many commentators are closely monitoring the labor market, in particular the unemployment rate, to try to gauge the severity of the economic downturn. The unemployment rate is widely used not only as an indicator of the amount of labor market slack but more broadly as a business cycle indicator, capturing how far below full capacity the economy is operating. While the record rise in new unemployment insurance claims received a lot of attention, the worsening of the official U.S. unemployment rate in the second quarter of 2020 was less severe than initially anticipated with some predicting rates as high as 30% (Faria-e-Castro 2020). Instead, the official unemployment rate climbed to 14.7% in April, then rapidly declined to 11.1% by the end of the second quarter. To put this decline into perspective, in a typical recovery, unemployment drops only about 0.05 percentage point per month (see, for example, Hall and Kudlyak 2020).
However, the official numbers have raised some doubts for two main reasons. First, stay-at-home orders and mandated business closures may severely hinder job seekers. Since people must be searching for work to be considered unemployed, the official unemployment rate may incorrectly record such individuals as outside of the labor force. Second, the Bureau of Labor Statistics (BLS) reported evidence in April and May that many workers who were not working for temporary, pandemic-related reasons were incorrectly recorded as “employed but absent from work” (BLS 2020a). Both of these issues imply that the official unemployment statistics may have severely understated the true magnitude of the increase in the unemployment rate in April and May.
In this Economic Letter, we propose a simple method to correct the official unemployment rate numbers for these biases. We find that the official data understated the unemployment rate in April and May by as much as 5 percentage points. However, we do not detect any substantial bias in the official numbers for June and July, which implies that the true drop in unemployment from April to June was even more dramatic than the official numbers indicated.
The definition of unemployment
To understand the possible biases in the official unemployment rate, one must consider its definition. Unemployment is defined as the share of the labor force that is without work but is both available and seeking employment. In the United States, the unemployment rate is measured by the Current Population Survey (CPS), a monthly survey of about 60,000 U.S. households conducted by the Census Bureau. In the CPS, people are classified as unemployed if they meet all of the following criteria:
- They were not employed during the survey reference week, typically, the week including the 12th of the month.
- They were available for work during the survey reference week, except for temporary illness.
- They made at least one specific active effort to find a job during the four-week period ending with the survey reference week, for instance by having a job interview, or they were temporarily laid off and are expecting to be recalled to their job.
Ambiguity in the definition of employment and unemployment
The main problem with the unemployment statistic is that the definitions of employment and unemployment become ambiguous in times of forced confinement, self-quarantining, and mandated business closures. This ambiguity can add substantial bias to the unemployment rate statistics.
One source of ambiguity stems from the job-search requirement in condition (3). If people are confined at home and not allowed to physically go to a workplace, can they be considered available for work and making active efforts to find work? The confinement may make them legally unavailable, even if they want to work. Also, active search efforts may simply not be possible when confinement disrupts the normal job interview process. The key underlying problem is that these challenges make criteria (2) and (3) ambiguous and open to interpretation. The ambiguity can create a lot of confusion for survey respondents. For instance, if some truly unemployed workers respond that they are not available for work because of the confinement, this would lead the BLS to underestimate the unemployment rate. A similar downward bias would result if job seekers cannot search for work because their industry is temporarily banned from operating.
Another source of ambiguity relates to the definition of employment stemming from condition (1). In its analysis of the May employment report (BLS 2020a), the BLS reported that some workers who were not at work during the entire reference week were not classified as unemployed on temporary layoff in April or May. Rather, they were classified as employed but “absent from work.” BLS’s subsequent analysis of the underlying data suggests that most of these workers were misclassified: they should have been classified as unemployed on temporary layoff. Again, ambiguity brought about by the nature of the pandemic led the official unemployment numbers to understate the true magnitude of the unemployment rate.
Removing ambiguity
To address these biases, we use a simple strategy that consists of broadening the definition of unemployment to accommodate the possible sources of ambiguity. Figure 1 displays our extended estimate alongside the official unemployment rate from 2000 to the end of 2019, each seasonally adjusted. Thus, the figure excludes the movements in the unemployment rate so far this year.
Figure 1
Official and extended unemployment rates: 2000-2019
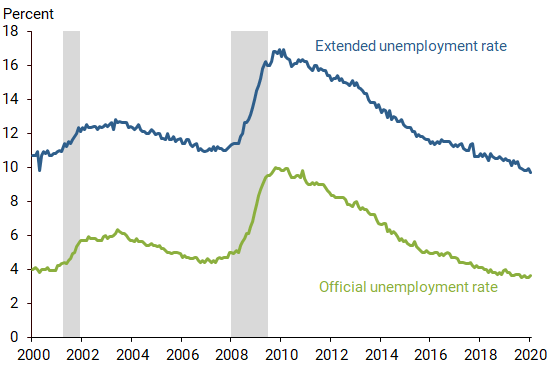
Note: Gray bars indicate NBER recession dates.
For our extended definition, we do two modifications. First, we relax conditions (2) and (3) by removing the need to be actively searching for work, as well as being available. Instead, we use responses to the CPS question, “(Do/Does) (name/you) currently want a job, either full or part time?” Our alternative measure of unemployment classifies respondents who answer yes to this question as being unemployed. This broader definition suffers far less from the types of ambiguity discussed earlier because being prevented from leaving your house should not change your hypothetical desire to work. Second, we remove the ambiguity from the definition of unemployment in condition (1) by classifying as unemployed any worker absent from work during the reference week.
As Figure 1 shows, our extended definition results in much higher unemployment on average than the official unemployment data would suggest, as expected. To measure the strength of the relationship between the official unemployment rate and our extended rate, we estimate a standard linear regression model over 2000–2019, excluding the pandemic period. The regression R-squared—a measure of statistical fit—is 0.98, implying an extremely high correlation. This means that our broader definition is just as good as the traditional definition for tracking the labor market cycle. In fact, as Figure 2 shows, we can accurately predict the official unemployment rate from our extended unemployment rate.
Figure 2
Official and model-predicted unemployment rates: 2000-2019
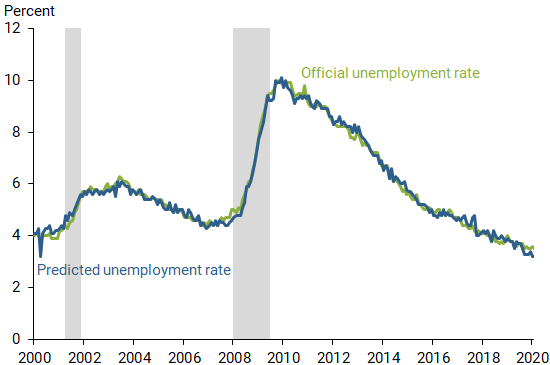
Note: Gray bars indicate NBER recession dates.
This strong relationship is especially useful in the current context, because it means that we can use our extended unemployment definition to better capture the true unemployment rate during the pandemic. Since our broader definition of the unemployment rate does not suffer from the ambiguity issues plaguing the official unemployment rate in this unique period, our predicted unemployment rate can be considered a corrected official unemployment rate. It predicts how the official numbers would have come out without the measurement issues affecting the official definition of unemployment.
Figure 3 plots the official unemployment rate (green line) alongside our corrected rate (blue line), with the gray shading indicating a 95% range of certainty for our estimates. Our corrected unemployment rate holds two main lessons. First, the spike in unemployment was much higher than suggested by the official numbers. Consistent with the downward bias created by ambiguity in the CPS questionnaire, unemployment reached 20.5% in April instead of the official 14.7%. Interestingly, our estimate is in line with the BLS’s own corrected unemployment rate of 19.1%, which is based on a different methodology (BLS 2020a). Second, and perhaps surprisingly, our corrected rate was similar to the official unemployment rates in June and July, implying a much faster recovery than implied by the official numbers, consistent with the BLS’s own assessment that “the degree of misclassification has declined considerably in recent months” (BLS 2020b).
Figure 3
Official and model-predicted unemployment: 2020
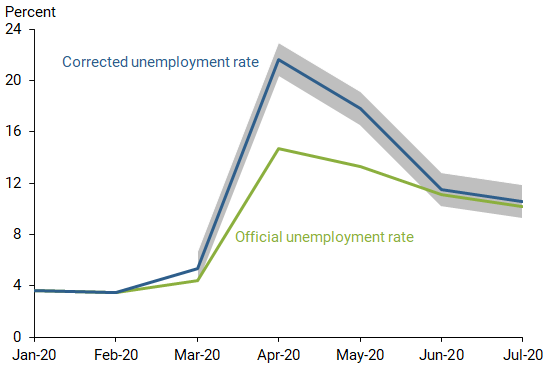
Note: Gray shading represents 95% range of confidence around estimate.
Figure 3 illustrates that, while this time has been extraordinary by historical standards, both the sudden climb in the unemployment rate from March to April and the sudden drop from April to June are actually understated in the official data. The larger rise and fall shown by our corrected series are consistent with the idea that a large part of the increase in unemployment was attributable to the mandates on mobility and business operations imposed to combat the spread of COVID-19.
The sensitivity of the true state of the labor market to these public health measures makes this a unique period. The evolution of the labor market going forward may look quite different from past recoveries from high unemployment. Its strength may well depend on the course of the virus and resulting tightening and loosening of government restrictions. For example, Petrosky-Nadeau and Valletta (2020) demonstrate how sensitive unemployment rate projections are to different scenarios for the path of the pandemic.
Conclusion
The public health response and restrictions on businesses intended to slow the spread of COVID-19 caused a sudden spike in unemployment in the United States. The response to the pandemic created a unique set of labor market conditions, with many workers separated from their jobs either not able to actively seek work or not viewing themselves as laid off. The resulting ambiguity in the survey questions underlying the definitions of employment and unemployment created substantial measurement error that caused the official unemployment rate to significantly undercount the true number of people who were unemployed. In this Letter, we propose a simple method to correct the official numbers for the effects of this ambiguity. We find that the official unemployment rate was substantially underestimated in April and May. Yet, the count was about right in June and July, implying that the true recovery in unemployment from April to June was even stronger than implied by the official data.
A broad lesson from our findings is that the pandemic-related confinement policies create unique challenges for measuring labor market conditions. An important implication is that past labor market recoveries may be a poor guide for what to expect from the U.S. labor market in the months ahead.
Regis Barnichon is a senior research advisor in the Economic Research Department of the Federal Reserve Bank of San Francisco.
Winnie Yee is a graduate student at the University of Chicago and a former research associate in the Economic Research Department of the Federal Reserve Bank of San Francisco.
References
Bureau of Labor Statistics. 2020a. “Frequently Asked Questions: The Impact of the Coronavirus (COVID-19) Pandemic on the Employment Situation for May 2020.” June 5.
Bureau of Labor Statistics. 2020b. “Frequently Asked Questions: The Impact of the Coronavirus (COVID-19) Pandemic on the Employment Situation for July 2020.” August 7.
Faria-e-Castro, Miguel. 2020. “Back-of-the-Envelope Estimates of Next Quarter’s Unemployment Rate.” FRB St. Louis, On the Economy Blog, March 24.
Hall, Robert E., and Marianna Kudlyak. 2020. “Why Has the U.S. Economy Recovered So Consistently from Every Recession in the Past 70 Years?” FRB San Francisco Working Paper 2020-20.
Petrosky-Nadeau, Nicolas, and Robert G. Valletta. 2020. “An Unemployment Crisis after the Onset of COVID-19.” FRBSF Economic Letter 2020-12 (May 18).
Opinions expressed in FRBSF Economic Letter do not necessarily reflect the views of the management of the Federal Reserve Bank of San Francisco or of the Board of Governors of the Federal Reserve System. This publication is edited by Anita Todd and Karen Barnes. Permission to reprint portions of articles or whole articles must be obtained in writing. Please send editorial comments and requests for reprint permission to research.library@sf.frb.org