
The Federal Reserve’s use of forward guidance and balance sheet policy means that monetary policy consists of more than changing the federal funds rate target. A proxy federal funds rate that incorporates data from financial markets can help assess the broader stance of monetary policy. This proxy measure shows that, since late 2021, monetary policy has been substantially tighter than the federal funds rate indicates. Tightening financial conditions are similar to what would be expected if the funds rate had exceeded 5¼% by September 2022.
Over the past two decades, and especially since the Great Recession, the conduct of monetary policy in the United States has grown beyond just setting a target for the short-term policy interest rate known as the federal funds rate. The use of forward guidance—communicating the likely course of future policy—to shape interest rate expectations started as early as 2003, when the Federal Open Market Committee (FOMC) started including direct language in its post-meeting statements. Forward guidance became a crucial tool for the FOMC after the federal funds rate hit the zero lower bound in 2008. At the same time, the balance sheet gained in importance as an additional tool for monetary policy when the FOMC initiated large-scale asset purchases.
When only one tool was being used before the 2000s, the stance of policy was directly related to the federal funds rate. However, the use of additional tools and increased policy transparency by FOMC participants has made it more complicated to measure the stance of policy. For example, in 2021–22, the FOMC lifted the funds rate target off zero and began a historically rapid pace of rate increases. It also slowed and eventually began reversing its balance sheet expansion. During this time, the FOMC provided guidance about its plans through its statements and public remarks by officials. In such an environment, the level of the federal funds rate target does not adequately convey the overall stance of monetary policy.
In this Economic Letter, we use a broad set of financial market indicators to construct a proxy measure of the federal funds rate. Updated from Doh and Choi (2016), this measure uses public and private borrowing rates and spreads to infer the broad stance of monetary policy. When the FOMC uses additional tools, such as forward guidance or changes in the balance sheet, these policy actions affect financial conditions, which the proxy rate translates into an analogous level of the federal funds rate. In other words, our measure interprets changes in financial conditions as if these conditions were driven solely by the funds rate.
The proxy measure suggests that the stance of monetary policy has recently been substantially tighter than the federal funds rate alone would indicate. Whereas the FOMC moved the target funds rate above its zero lower bound in March 2022, the proxy measure had already moved positive in November 2021 and increased quickly thereafter. By September 2022, the proxy rate was above 5¼%, much higher than the actual funds rate. This difference reflects additional tightening from using forward guidance and the balance sheet. Accounting for the broader stance of policy and comparing the proxy rate to simple rules suggests U.S. monetary policy tightened sooner and more sharply than has been generally recognized.
A proxy federal funds rate
The federal funds rate hit the zero lower bound in December 2008, and the FOMC subsequently began using forward guidance and asset purchases to stimulate the economy. This prompted economists to develop ways to measure the additional policy accommodation (for example, Krippner 2013, Wu and Xia 2016, and Lombardi and Zhu 2018). The “proxy funds rate” measure we use in this Letter and will update monthly, extended from the analysis by Doh and Choi (2016), can assess the stance of policy when the federal funds rate is zero and estimate the broad stance of policy when the rate is above zero.
The proxy rate incorporates broad financial conditions and is constructed to match the actual federal funds rate before the end of 2008, when the zero lower bound started. We construct the proxy rate using a statistical method called principal components to extract common movements among 12 financial market variables, including Treasury rates, mortgage rates, and borrowing spreads. We then map the principal components to levels of the federal funds rate, where the mapping reflects the pre-2008 correlations between them. Until December 2008, the mapping is nearly exact by construction; after 2008, the mapping from financial conditions to the funds rate diverges. This separation displays how the proxy funds rate responds to developments in financial conditions such as forward guidance and balance sheet operations. The proxy rate can be interpreted as indicating what federal funds rate would typically be associated with prevailing financial market conditions if the funds rate were the only monetary policy tool being used.
Figure 1 shows the monthly effective federal funds rate and proxy rate from June 1976 to September 2022. In the period before December 2008, these series align nearly perfectly, meaning that the proxy rate captures almost all the variation in the effective funds rate. However, starting around July 2003, there is a slight shift in the alignment of the two series, as the proxy rate tends to lead the funds rate. This shift corresponds to when the FOMC started regularly using a version of forward guidance to communicate that it was likely to move the funds rate. Forward guidance provided financial markets and the public with information about the FOMC’s monetary policy stance that was not previously available. More generally, the proxy rate captures financial market expectations of future policy and encapsulates all available information provided by the FOMC in both its actions and its communications.
Figure 1
Effective federal funds rate and proxy rate, 1976–2022
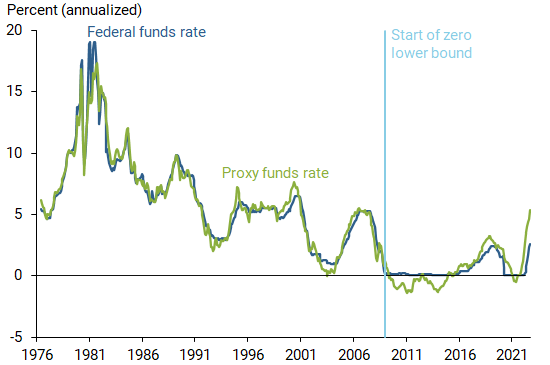
Source: Federal Reserve Board of Governors, Freddie Mac, The Bond Buyer, Moody’s, and authors’ calculations.
Note: Monthly updates of the full data series can be downloaded on the Proxy Funds Rate data page.
After 2008, the series diverged when the use of additional policy actions drove a wedge between the funds rate and the full stance of monetary policy, as estimated by the proxy rate. Figure 2 focuses on the comparison from 2009 to 2022. The divergence can be seen through the constrained path of the funds rate and the proxy rate’s decline below zero in the early 2010s. Monetary policy accommodation through forward guidance and multiple rounds of asset purchases played a critical role in this movement.
Figure 2
Effective federal funds rate and proxy rate, 2009–2022
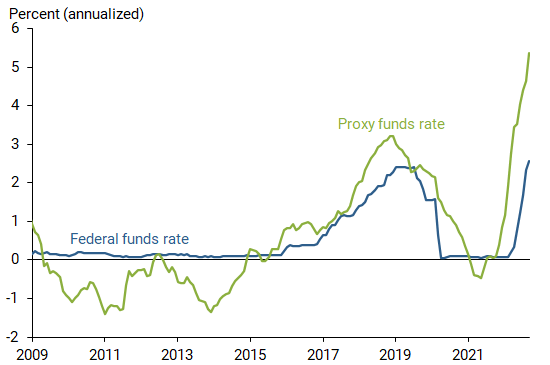
Source: Federal Reserve Board of Governors, Freddie Mac, The Bond Buyer, Moody’s, and authors’ calculations.
Note: Data will be updated monthly on the Proxy Funds Rate data page.
Starting in 2015, the FOMC began a tightening cycle. This period was reflected by the federal funds rate increasing. However, the proxy rate shows that the policy “lift-off” effectively started earlier than that. In July 2019, the FOMC started easing policy again, which also was predated by a decline in the proxy rate as early as January 2019. This early shift coincided with the FOMC clarifying that the ongoing balance sheet runoff would be a secondary tool and the federal funds rate would be the primary. Furthermore, the FOMC signaled in July that it would be patient with possible continued rate increases; in retrospect, no further increases would occur.
When the COVID-19 pandemic hit, the FOMC lowered the funds rate to zero and started expanding its balance sheet again to stimulate the economy. Interestingly, the proxy rate remained above zero for the early part of the pandemic and fell into negative territory thereafter. This result appears to reflect a substantial shock to financial markets that tightened conditions more than the FOMC’s aggressive easing.
The divergence between the funds rate and the proxy rate since late 2021 is notable. It shows that, during the current tightening cycle, policy has been more stringent than indicated by a modest view of the funds rate. While the federal funds rate didn’t lift off until March 2022, the proxy rate moved positive as early as November 2021. This timing reflects a tightening of financial conditions due to an anticipated slowdown in asset purchases, which also aligns with FOMC communications on future policy. As the FOMC slowed purchases, increased the funds rate, and signaled future rate increases, the proxy rate quickly moved higher. By September 2022, the FOMC moved the funds rate up to over 3%, used forward guidance to signal ongoing rate increases, and began winding down the balance sheet. These policy actions tightened financial conditions faster than in previous cycles (Daly 2022) and are associated with the proxy rate being above 5¼% in September 2022.
Comparing the proxy rate with policy rules
Simple rules are often used as guideposts for the conduct of monetary policy. However, these rules often focus solely on the federal funds rate rather than on the full range of FOMC policy tools. For example, the well-known Taylor rule predates the use of both forward guidance and the balance sheet.
Figure 3 shows the evolution of the federal funds rate (blue line) and our proxy rate (green line) relative to real-time quarterly rules produced by the Federal Reserve Bank of Cleveland (2022). These rules consider 21 different prescriptions that vary in the policy rule used as well as the concept of inflation and the output gap. The figure shows the median (gray line) and interquartile range (gray shading) prescribed by the 21 rules.
Figure 3
Comparing proxy and funds rate with monetary policy rules
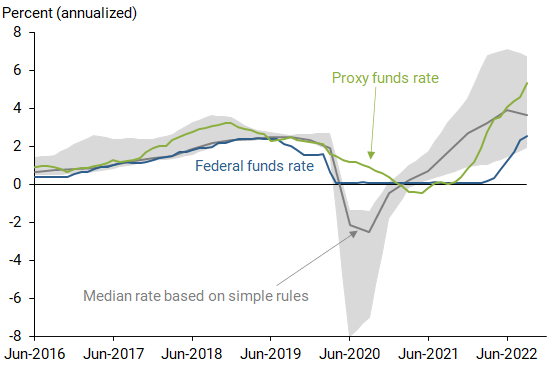
Source: Simple Monetary Policy Rules (quarterly data, FRB Cleveland 2022), Federal Reserve Board of Governors, Freddie Mac, The Bond Buyer, Moody’s, and authors’ calculations.
The median of the rules places the funds rate at 3.67% in the third quarter of 2022, slightly higher than the funds rate that averaged about 2.5% in September. The funds rate was a little above 3% by the end of September, but this was still much lower than the proxy rate of over 5¼%. Looking at the funds rate alone would suggest that policy is relatively looser than most rules would prescribe. In contrast, by accounting for the broader stance of policy, our proxy rate indicates that policy is tighter than most rules prescribe.
An important caveat to the proxy rate measure is that it implicitly assumes the interaction between financial markets and monetary policy was relatively stable before and after the Great Recession. To the extent that this relationship has changed, the proxy rate might be an imperfect measure of the stance of policy. However, such a change would also cast doubt on the rationale for using pre-2008 simple monetary policy rules as guideposts and would not change our conclusion that these rules could be more meaningful in comparison to a broader policy stance measure than the federal funds rate alone.
Conclusion
The FOMC’s use of forward guidance provides more information about future policy than what is reflected in the federal funds rate alone. Similarly, the use of the balance sheet has a monetary policy impact that is not captured in the federal funds rate. A proxy funds rate based on financial conditions measures the broader stance of policy and suggests that these combined policy tools have a more complex effect on the economy than the federal funds rate indicates. The stance of monetary policy in September 2022 was conducted as if the policy rate was above 5¼%, as opposed to the actual rate of 3-3¼%. As the FOMC increasingly used forward guidance and the balance sheet, the proxy rate has tended to lead the actual funds rate, reflecting the fact that financial markets are forward looking.
Jason Choi is a PhD student at the University of Wisconsin-Madison.
Taeyoung Doh is a senior economist at the Federal Reserve Bank of Kansas City.
Andrew Foerster is a senior research advisor in the Economic Research Department of the Federal Reserve Bank of San Francisco.
Zinnia Martinez is a research associate in the Economic Research Department of the Federal Reserve Bank of San Francisco.
References
Daly, Mary C. 2022. “Policy Nimbleness Through Forward Guidance.” FRBSF Economic Letter 2022-17, June 28.
Doh, Taeyoung, and Jason Choi. 2016. “Measuring the Stance of Monetary Policy on and off the Zero Lower Bound.” FRB Kansas City Economic Review 101(3), pp. 5-21.
Federal Reserve Bank of Cleveland. 2022. “Simple Monetary Policy Rules.” Accessed October 17, 2022.
Krippner, Leo. 2013. “Measuring the Stance of Monetary Policy in Zero Lower Bound Environments.” Economics Letters 118(1), pp. 135–138.
Lombardi, Marco J., and Feng Zhu. 2018. “A Shadow Policy Rate to Calibrate U.S. Monetary Policy at the Zero Lower Bound.” International Journal of Central Banking 14(5), pp. 305–346.
Wu, Jing Cynthia, and Fan Dora Xia. 2016. “Measuring the Macroeconomic Impact of Monetary Policy at the Zero Lower Bound.” Journal of Money, Credit, and Banking 48(2-3), pp. 253–291.
Opinions expressed in FRBSF Economic Letter do not necessarily reflect the views of the management of the Federal Reserve Bank of San Francisco or of the Board of Governors of the Federal Reserve System. This publication is edited by Anita Todd and Karen Barnes. Permission to reprint portions of articles or whole articles must be obtained in writing. Please send editorial comments and requests for reprint permission to research.library@sf.frb.org