
The Summary of Economic Projections offers important insights into the views of Federal Open Market Committee participants. The summary’s “dot plot” charts each participant’s assessment of the appropriate path for monetary policy given their economic outlook. A new index measuring the level of disagreement indicated by the dots shows that disagreement fell during the 2010s expansion, was nearly nonexistent early in the pandemic, and has been increasing recently. Policy disagreement is correlated with disagreement about future inflation, but factors unrelated to disagreement about the outlook also play a large role.
The Federal Open Market Committee (FOMC) has published economic forecasts from meeting participants in its quarterly Summary of Economic Projections (SEP) since 2007. These reports include forecasts for inflation, real GDP growth, and the unemployment rate for the current and two subsequent calendar years as well as the long run. In 2012, each participant also began including a projected path for the federal funds rate that would be appropriate given their own economic forecasts. Known commonly as the “dot plot,” the chart displays dots that show how each participant thinks policy should evolve by the end of the current and future years (Federal Reserve 2020).
The dot plot not only indicates the expected path of policy but also provides some insights into how similar or dissimilar participants’ views of appropriate policy are. If all FOMC members held the same views on the appropriate path of policy, the dots would be perfectly aligned. Since the dots typically do not align, the degree of disparity between them gives an indication of the level of disagreement at any point in time. The dispersion of the dots could reflect disagreement by FOMC members in their economic forecasts or disagreement about the appropriate policy response even with identical forecasts.
In this Economic Letter, we study the extent of disagreement in the dot plot over time. As the forecast horizon moves from current to future years, disagreement about the policy rate path increases. Since policymakers can disagree about the appropriate policy path to different degrees at different horizons of the projections, we develop an index of disagreement that summarizes these forecast horizons. It indicates that disagreement about the policy rate path fell during the economic expansion of the 2010s and was nearly nonexistent during the depths of the pandemic. However, it has been increasing since then and rose above its average level in the first two quarters of 2023.
Finally, we consider the sources of policy disagreement by constructing measures of disagreement in SEP forecasts for the economic outlook. Disagreement about the policy rate path is correlated with disagreement about the outlook for inflation but not with GDP growth or the unemployment rate. Disagreement about the economic outlook accounts for only about a third of the disagreement about policy, suggesting that factors unrelated to the outlook such as policy preferences, which are beyond the scope of this Letter, play a larger role.
Measuring disagreement in the SEP
Every quarter as part of the SEP, all FOMC participants—including the Federal Reserve Board of Governors and each Federal Reserve Bank President—report their forecasts for GDP growth, the unemployment rate, and both headline and core personal consumption expenditures (PCE) inflation. Participants are asked to forecast these indicators assuming that the federal funds rate follows a path that they view as appropriate given current and expected macroeconomic conditions. They report their economic projections, including their federal funds rate forecasts, for the end of the current year, one year ahead, and two years ahead. They also provide estimated values for these variables in the long run. In practice, the SEP forecast for the federal funds rate is a key part of forward guidance that helps set the overall stance of monetary policy (Choi et al. 2022).
The FOMC publicly releases the SEP with limited details of the federal funds rate forecasts. While the set of forecasts are displayed for each horizon, it is unknown which participant made a specific forecast until details are released publicly with a five-year lag. Nonetheless, the SEP provides information about the views of FOMC participants on how appropriate monetary policy should unfold. Deviations from the median forecast give an indication of the dispersion of beliefs among participants. Such dispersion can stem from disagreement about expectations for certain economic conditions, disagreement about how policy should respond to those conditions, or both.
Figure 1 shows measures of deviations in federal funds rate forecasts at three horizons—the current year (blue), one year ahead (green), and two years ahead (yellow). These reflect the average absolute deviation from the median, adjusted for seasonal changes during the year to account for forecasts naturally converging by the end of the year. Lower values indicate fewer deviations either above or below the median, meaning that participants have similar forecasts. Higher values indicate a wider range of forecasts.
Figure 1
Dispersion in SEP policy rate forecasts
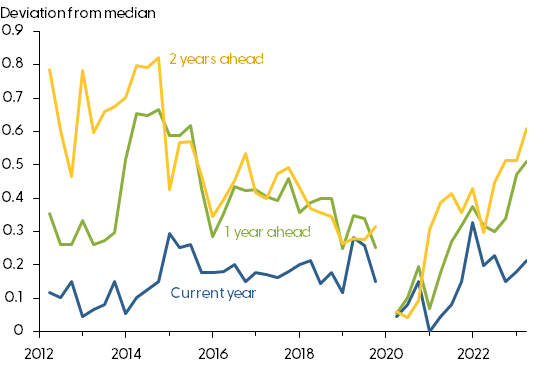
Source: Summary of Economic Projections and authors’ calculations.
Note: Values reflect average absolute deviation from median forecast, adjusted for seasonal factors; gap reflects that no SEP forecast was released in 2020:Q1.
The figure reveals some interesting dynamics about disagreement over time. For any given quarter, the deviations in SEP forecasts almost always increase with the length of the forecast horizon. In other words, there tends to be relatively less disagreement about policy in the year the forecast is made, but more disagreement about the next year, and even more about the following year. This result reflects more scope for different views as the forecast looks into the future because many more things can happen the farther ahead one looks.
Figure 2 presents a new index of disagreement we developed, which summarizes the deviations across the three horizons into a single number at any given point in time. We use a statistical procedure called principal component analysis to create a weighted average of the forecast deviations in Figure 1. Intuitively, the index captures a type of underlying disagreement in SEP forecasts. When this index of underlying disagreement is low, the deviations in forecasts will be low across all horizons; as underlying disagreement increases, the deviations at the current year horizon will tend to increase a little, and disagreement about policy will increase at the longer horizons a bit more. The index is constructed so that a value of zero indicates no disagreement—all participants have identical policy forecasts at all three horizons—and a value of one indicates the pre-pandemic average level of disagreement.
Figure 2
Index of disagreement in SEP policy rate forecasts
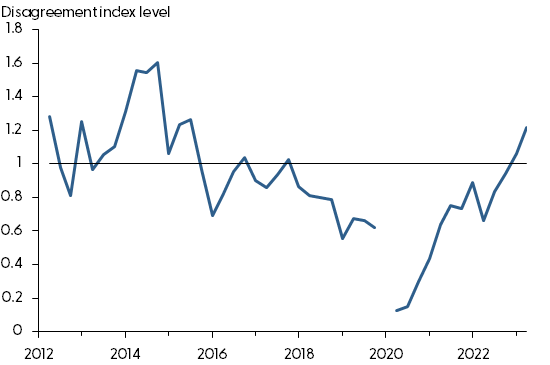
Source: Summary of Economic Projections and authors’ calculations.
Note: Values reflect weighted average level of disagreement with median forecast: 0 equals no deviation; 1 equals pre-pandemic average.
The dynamics of the disagreement index in Figure 2 reveal more clearly some of the trends depicted in Figure 1. For example, the first few years show a high level of disagreement in the SEP forecasts, which falls to lower levels for the second half of the 2010s. Interestingly, disagreement tended to be higher when the federal funds rate was at its zero lower bound until the end of 2015, and disagreement tended to be lower after the funds rate rose.
When the COVID-19 pandemic hit in early 2020, the FOMC lowered the target range for the federal funds rate to near zero and skipped the March 2020 SEP round. Once the SEP resumed in June 2020, disagreement was almost nonexistent, as all participants reported the need for a low policy rate. A low level of disagreement was also apparent as the economy rebounded and inflation started to increase—FOMC participants soon pivoted to forecasting higher federal funds rates. By the June 2023 FOMC meeting, the target federal funds rate had increased to between 5 and 5¼%, and disagreement among the participants was above its pre-pandemic average level.
The dynamics of disagreement during the two expansions display a notable contrast. In the 2010s, disagreement was high when the policy rate was held near zero, then declined when the federal funds rate rose above zero. Conversely in the 2020s, disagreement was low when the policy rate was held near zero and has grown as the policy rate has increased. This contrast indicates that the direct stance of policy may not be the most important factor in explaining the level of disagreement.
What drives policy disagreement?
To assess what may be driving changes in the index of disagreement shown in Figure 2, we turn to disagreement about the economic outlook and see to what extent it might correlate with policy disagreement. As noted, FOMC participants also give forecasts for real GDP growth, the unemployment rate, and inflation, which are reported in the SEP as median values with their range of values. However, whereas the SEP reveals a dot plot for the policy rate forecast, a dot plot for the outlook is not released to the public until after a five-year lag. In other words, we do not have forecasts for each policymaker in this case. This limitation means that we cannot construct forecast deviations and indexes analogous to Figures 1 and 2. As a result, we rely on an alternative measure of disagreement for the economic outlook.
To characterize the disagreement about the outlook, we use the width of the range of values in the SEP rather than the full set of individual forecast deviations, but otherwise use the same method to extract a single measure of disagreement over all forecast horizons. The alternative measures presented in Figure 3 are less precise about the extent of disagreement than our policy index in Figure 2. For example, the range of values might overstate the amount of disagreement due to outlier views, or it might understate the level of disagreement if there is more bunching at the top and bottom of the range.
The measures in Figure 3 can be used to show to what extent disagreement about the outlook might be increasing or decreasing. The figure shows that disagreement about the economic outlook generally decreased during the 2010s expansion. During that time, SEP forecasts about real GDP growth went from persistent overoptimism to being relatively more accurate (Lansing and Pyle 2015, Lansing and Yee 2020). In 2020, disagreement about real GDP and unemployment was high but has since decreased. In contrast, disagreement about inflation in 2020 was high and has since increased.
Figure 3
Measures of disagreement for the outlook
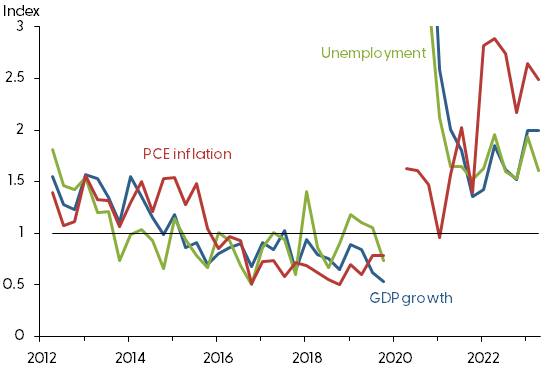
Source: Summary of Economic Projections and authors’ calculations.
Note: Values reflect weighted average level of disagreement from range of forecasts: 0 equals no range width, 1 equals pre-pandemic average. Vertical axis is truncated to ignore large values in 2020.
To assess the potential drivers of policy disagreement, we consider a regression model that examines the relation between the index of disagreement in Figure 2 and the outlook disagreement measures in Figure 3. Our analysis shows that disagreement about GDP growth and the unemployment rate are not statistically related to policy disagreement. However, higher disagreement about inflation tends to be associated with higher disagreement about policy. For example, since 2020, disagreement about the inflation outlook rose in line with disagreement with policy, whereas it fell for growth and unemployment. In addition, outlook disagreement measures only explain about a third of the variation in policy disagreement. We thus conclude that, while disagreement about the inflation outlook is a key component of disagreement about policy, factors other than those related to disagreement about the outlook that are beyond the scope of this Letter play an important role in policy disagreement.
Conclusion
The dot plot in the Summary of Economic Projections shows that FOMC meeting participants’ forecasts for the federal funds rate can indicate a level of disagreement about the future path of monetary policy. Our index of disagreement characterizes how that disagreement has evolved over time. Statistical results suggest that disagreement about PCE inflation plays a larger role than other outlook indicators. However, factors unrelated to disagreement about the outlook also appear to play a key role.
Senior Research Advisor, Economic Research Department, Federal Reserve Bank of San Francisco
Zinnia Martinez
Research Associate, Economic Research Department, Federal Reserve Bank of San Francisco
References
Choi, Jason, Taeyoung Doh, Andrew Foerster, and Zinnia Martinez. 2022. “Monetary Policy Stance Is Tighter than Federal Funds Rate.” FRBSF Economic Letter 2022-30 (November 7).
Federal Reserve Board. 2020. Guide to the Summary of Economic Projections.
Lansing, Kevin J., and Benjamin Pyle. 2015. “Persistent Overoptimism about Economic Growth.” FRBSF Economic Letter 2015-03 (February 2).
Lansing, Kevin J., and Winnie Yee. 2020. “Wringing the Overoptimism from FOMC Growth Forecasts.” FRBSF Economic Letter 2020-03 (February 10).
Opinions expressed in FRBSF Economic Letter do not necessarily reflect the views of the management of the Federal Reserve Bank of San Francisco or of the Board of Governors of the Federal Reserve System. This publication is edited by Anita Todd and Karen Barnes. Permission to reprint portions of articles or whole articles must be obtained in writing. Please send editorial comments and requests for reprint permission to research.library@sf.frb.org