Yield curves can move up and down and change shape daily as interest rates change (see July 2004 Ask Dr. Econ). Because inflationary expectations typically are quickly—although
not necessarily fully—incorporated into the nominal interest rates observed in financial markets, they are important factors in determining market or nominal interest rates and shifts in yield curves.
Inflation
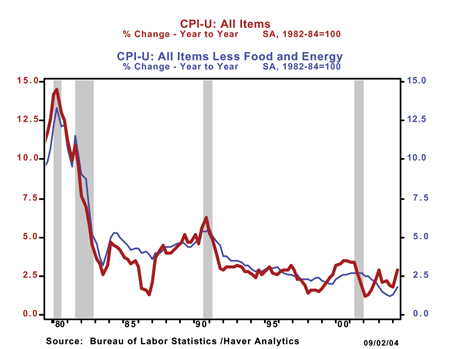
Inflation, the overall change in the price level, is not a constant, as can be seen in Chart 1. Over the past 25 years inflation rates—measured by the Consumer Price Index (CPI),
and the Core CPI —have varied dramatically, reaching a peak of around 13 percent in 1980 and falling below 2 percent at times after 2001. The CPI is a measure of inflation that the
Bureau of Labor Statistics publishes that provides "…monthly data on changes in the prices paid by urban consumers for a representative basket of goods and services.” The Core CPI is a measure of inflation that excludes food and energy
products from the CPI. Of course, changes in the inflation rate measured by these and other inflation indicators often may result in changes in inflationary expectations.
Chart 1
Interest rates, inflationary expectations, and the real rate of interest
The interest rates your bank pays on deposits or the interest rate yields you see quoted in the newspaper for U.S. Treasury securities are “nominal interest rates,” that is, unadjusted for inflation. When inflation and inflationary expectations, or both change, nominal interest rates will tend to adjust, and may result in shifts in the slope, shape, and level of the yield curve, as well
changes in the estimated real interest rate (see August 2003 Ask Dr. Econ). The real interest rate is estimated by excluding inflation expectations from
the nominal interest rate.
Thus, a key general relationship to remember about interest rates and inflation is:
Nominal
Interest Rate = Estimated Real Interest Rate + Inflationary Expectations
Of course, nominal interest rates come directly from the financial pages of your newspaper or the Federal Reserve Board’s online Release H.15, Selected Interest Rates. In the paragraphs
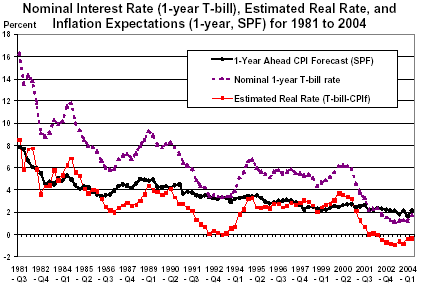
below, we note several ways to find estimates of future inflation. With this information, you may estimate a real interest rate, like the one shown below in Chart 2.
Real interest rates play an important role in the economy because real interest rates affect the demand for goods and services through borrowing costs. As is described in U.S. Monetary Policy: An Introduction (2004),
published by the Federal Reserve Bank of San Francisco, “Changes in real interest rates affect the public’s demand for goods and services mainly by altering borrowing costs, the availability of bank loans, the wealth of households, and foreign exchange
rates.”
Let’s put these three series—nominal interest rates, real interest rates, and inflationary expectations—together and see how they behaved from 1981 to 2004. For nominal interest rates, we will use the 1-year Treasury bill yield (constant maturity
series)—shown as the dashed purple line in Chart 2. Inflationary expectations for the year ahead come from the Federal Reserve Bank of Philadelphia’s Survey of Professional Forecasters (SPF)—shown
as the black line in Chart 2. Using these two series, we can calculate the real or inflation-adjusted returns for each month—the red line in Chart 2—by subtracting inflationary expectations from the nominal interest rate. Remember, if
the inflation rate (see October 2002 Ask Dr. Econ) is zero, then nominal interest rates should equal real interest rates.
Estimated real interest rates plotted in Chart 2 show a lot of variation from 1981 to 2004. From a high of over 8 percent in 1981, real interest rates trended downward, until 2003 and 2004, when the estimated real rate of interest dropped below zero.
This means nominal interest rates actually fell below the expected inflation rate. In other words, it looks like a good time to be a borrower!
Chart 2
Inflationary expectations and the yield curve
The 1-year ahead SPF CPI inflation forecasts shown in Chart 2 indicate a pronounced downward trend in inflationary expectations over the 1981 to 2004 period. Nominal interest rate also trended
much lower over the period.
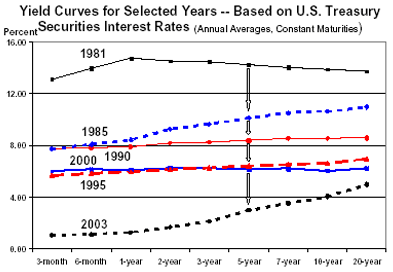
The downward trend in nominal interest rates and inflation also shows up in comparisons of yield curves over the period from 1981 to 2003. Chart 3 presents annual yield curves for six years (1981, 1985, 1990, 1995, 2000, and 2003). The pattern of downward
shifts in the yield curves shown in Chart 3 is consistent with declines in inflationary expectations over the period.
Chart 3
Why should you consider inflation in your financial decisions?
Most economies experience some inflation. Failure to anticipate future inflation when lending, especially on long-term securities or loans, can be costly—either
in terms of lost interest or discounted value, or both.
For a simple example of why it is important to anticipate future inflation when making financial decisions, suppose that in early 2004 you make a 10-year fixed-interest rate loan to a friend at what looks like a sound interest rate by today’s standards,
say a 6 percent annual rate. The course of inflation over the term of the loan will determine the real financial benefits of the 6 percent loan. If inflation averages only 2 percent per year, your real return will average 4 percent. However,
if inflation averages 7 percent per year, your return after inflation will average -1 percent—your money will actually lose real purchasing power each year.1 So, it’s a good idea to consider
the course of inflation when investing or borrowing money.
How might you go about estimating inflation, without building a complex econometric model of the economy like the ones that economic forecasters use to project future trends for key economic variables like inflation? Here are a couple of suggestions.
Estimating future inflation: Use the inflation rate
Let’s look first at the simplest way to estimate inflation. We’ll start with the Consumer Price Index (CPI), a widely used measure
of inflation in the consumer sector. The CPI for all items rose 3.0 percent from July 2003 to July 2004. The CPI is shown as the heavy red line in Chart 1. However, many economists prefer to use an alternative measure of the CPI, known as the
Core CPI. The Core CPI rose only 1.8 percent over the same period, because the Core CPI does not include the volatile food and energy components (remember energy prices rose spiked in 2003 and 2004). As a result, the Core CPI tends to record
a more stable trend in inflation over time, as can be seen from the thin blue line in Chart 1. The simplest way to estimate of future inflation would be to assume that the rate of inflation for the past year will continue through the next year—3.0
percent for the CPI and 1.8 percent for the Core CPI. See the BLS web site at the beginning of the paragraph for the most recent CPI data to update your projections.
Estimating future inflation: Ask the economists
A more sophisticated method would be to use the projections on future inflation estimated by a group of economic forecasters—like the series shown in Chart 2. So, check out the
FRB Philadelphia’s Economic Research web site for the SPF inflation expectations. As of the second quarter of 2004, the short-term SPF inflation forecast for the year ahead was 2.1 percent. The long-term inflation forecast—the estimated
annual average inflation rate over the next 10 years—generated from the survey was 2.5 percent. So, at mid-year 2004, the economy was in a period of low inflation combined with generally low expectations of future inflation.
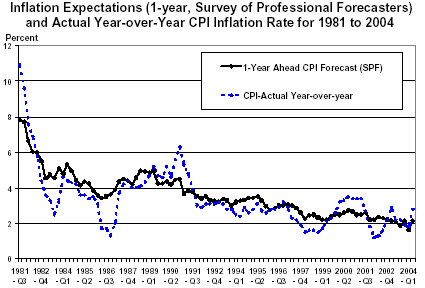
Chart 4 provides a comparison of the inflationary expectations over the period from 1981 to 2004 using both the SPF 1-year ahead forecasts and the current inflation rate measured by the current CPI Index. While both measures tend to move together, the
SPF forecast tends to show less volatility than the actual CPI.
Chart 4
FedViews too!
Price level stability is a key goal of the Federal Reserve so most forecasts of the economy will discuss the outlook for inflation. Dr. Econ finds the monthly FedViews forecast from the Federal Reserve Bank of San Francisco web site to be a good source for up-to-date information on inflation trends. FedViews typically discusses recent inflation measures and contains an up-to-date assessment of future inflationary trends.
Endnotes
1. Borrowers who make payments that are based on nominal interest rates—say an adjustable rate mortgage or a credit card that is priced based on the prime rate—also face a risk. In this case the risk is that their nominal loan payments
will rise with inflation and interest rates.
References
Blanchard, Oliver. (1997) Macroeconomics, Prentice-Hall, Upper Saddle River, New Jersey. See Chapter 9.
Consumer Price Index, Bureau of Labor Statistics web site. http://www.bls.gov/cpi/home.htm
FedViews, Federal Reserve Bank of San Francisco web site. https://www.frbsf.org/publications/economics/fedviews/index.html
Rose, Peter S. (1994) Money and Capital Markets, Irwin, Burr Ridge, Illinois. See Chapter 9 for additional information on the structure of interest rates.
Selected Interest Rates (H.15 Release), Federal Reserve Board of Governors web site. http://www.federalreserve.gov/releases/
Stiglitz, Joseph E., and Carl E. Walsh. (2002) Principles of Macroeconomics. W.W. Norton & Company, New York. See Chapter 4.
Survey of Professional Forecasters, Federal Reserve Bank of Philadelphia web site. http://www.phil.frb.org/econ/spf/index.html