The decline in bank loans after their peak in the third quarter of 2008 was the largest contraction in percentage terms during the post-World War II period.1 Yet the decline during the Great Recession was not nearly as dramatic as the downturn that occurred during the Great Depression of the 1930s.
To answer your question, let’s use some common measurements for bank lending to compare these two periods. For this comparison, we need to find comparable historical data for the two periods. Fortunately, pre-1947 records are available in a format similar to more recent data, although statistics were not collected and reported as frequently.
Bank Lending in the Great Depression
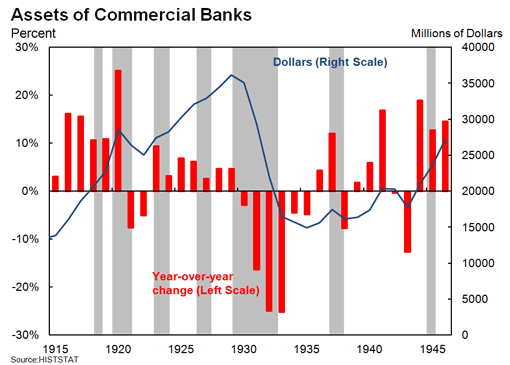
First, let’s examine what happened to bank lending in the Great Depression. Figure 1 presents commercial bank loans in two formats, outstanding values (blue line) and annual percentage rate of change in loans (red bars). This figure helps us to evaluate the period from 1915 to 1946, including the Great Depression. The period includes seven recessions as defined by the National Bureau of Economic Research or NBER and shown as gray shaded bars.2
The 1929 financial crisis and the Great Depression took a huge toll on commercial bank lending, which at the time represented the bulk of total lending in the economy.3 Figure 1 provides dramatic evidence of how bank lending plunged following the stock market collapse in 1929 and the onset of the Great Depression.4 Total loan values, which peaked at nearly $36 billion in 1929, fell by more than $21 billion or 58.5 percent over the next 5½ years (blue line in Figure 1). At the same time, economic output contracted and led to a period of deflation, when the overall price level fell sharply for several years. The annual percentage change (red bars in Figure 1) indicate that loans plummeted by more than 20 percent in both 1932 and 1933 and contracted for six consecutive years from 1930 to 1935.
Figure 1. Total Loans at All Commercial Banks Collapsed in the Great Depression
Lending in the Great Recession Compared with the Great Depression
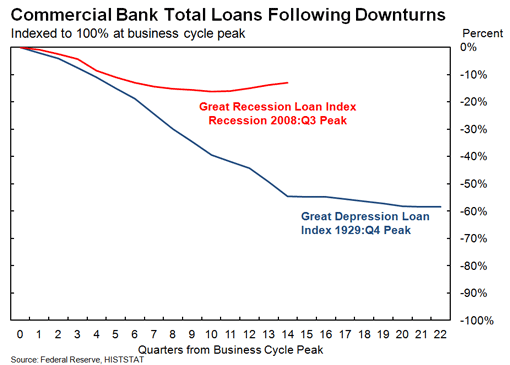
Generating a comparison between lending in the Great Depression and the Great Recession presents some challenges. Loan data are not available on the same frequency for the two periods and differences in the scale are huge. To adjust for these differences, I constructed an index with a value of 100 representing the pre-crisis peak in loans for both periods.5 This index, shown as Figure 2, tracks percent changes in total bank loans for both periods on the same scale.6
Figure 2 shows that the decline in loans during the Great Recession pales in comparison to the Great Depression. In the most recent episode, ten quarters after the 2008 peak in bank lending, total loans had fallen by over 16 percent, which is a dramatic decline by post-World War II standards but small compared to the drop of 39 percent for the first ten quarters of the Great Depression.
Figure 2 also shows that bank lending increased slightly in the recovery following the Great Recession, starting ten quarters after the financial crisis peak. This modest growth resulted from improved bank industry conditions, looser lending standards, and increased loan demand.7
In contrast, following the Great Depression, total loans continued to decline at a rapid pace much longer. When loans outstanding finally stabilized, it was at a level about 58 percent below the 1929 peak. Thus, the decline in lending during the Great Depression was much more severe and lasted much longer than during the Great Recession.
Figure 2. The Decline in Bank Loans in the Great Depression Lasted Longer and Was Much More Severe than in the Great Recession.
How large was the decline in lending as a share of the economy?
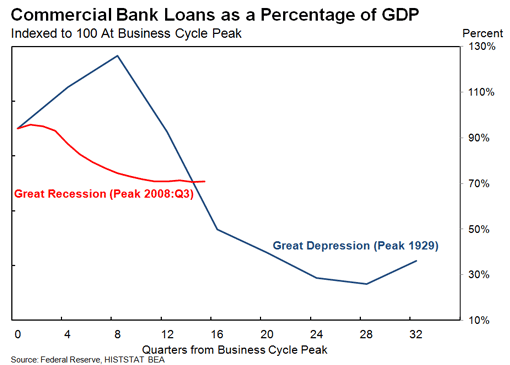
We can take this analysis a step further using the available historical data and scaling bank loans as a percent of gross domestic product (GDP), the total output of the economy over a period of time. This allows us to account for the deeper and longer decline in GDP during the Great Depression.
This measure, shown in Figure 3, plots bank loans as a share of GDP for both periods. Over the course of the Great Depression this measure fell about 57 percent from the business cycle peak to the trough seven years later.8 In contrast, during the Great Recession, bank loans as a percentage of GDP fell less than 20 percent from the peak to the trough four years later. Again, by this measure as well, the downturn in lending relative to the size of the overall economy was more severe during the Great Depression.
Figure 3. The Decline in Bank Loans as a Share of Gross Domestic Product also Was More Severe in the Great Depression than in the Great Recession.
Date of publication: Third Quarter 2012
Further Reading
Jorda, Óscar. 2012. “Credit: A Starring Role in the Downturn.” FRBSF Economic Letter 2012-12, Federal Reserve Bank of San Francisco, April 16, 2012.
Strahan, Philip E. 2012. “Liquidity Risk and Credit in the Financial Crisis.” FRBSF Economic Letter 2012-15, Federal Reserve Bank of San Francisco, May 14, 2012.
See also the following Dr. Econ Responses:
“How severe was the decline in bank lending that followed the 2008 financial crisis and recession and has it turned around? “ Ask Dr. Econ, Federal Reserve Bank of San Francisco website, (forthcoming)
“How does the Federal Reserve define “loans and leases,” and how do they relate to “commercial and industrial loans”?” Ask Dr. Econ, Federal Reserve Bank of San Francisco website, November 2004.
“How do you define “Commercial Loans” and what is the economic importance of these types of loans?” Ask Dr. Econ, Federal Reserve Bank of San Francisco website, September 2000.
“Please Explain How Financial Markets May Affect Economic Performance.” Ask Dr. Econ, Federal Reserve Bank of San Francisco website, January 2005.
Bank Lending Data:
H.8 Release, Assets and Liabilities of Commercial Banks in the United States. Federal Reserve Board.
Bank Data Guide. Federal Deposit Insurance Corporation (FDIC). This website provides users with the ability to download and review data from individual banks, from groups of banks, and for all banks.
Endnotes
1. For more information on the severity of the decline in bank lending during the Great Recession, please see Dr. Econ’s answer (How severe was the decline in lending in the Great Recession, forthcoming).
2. See Dr. Econ, June 2003, “Which organization determines whether the U.S. economy is in a recession…” or Dr. Econ, January 2008, “How many recessions have occurred in the U.S. economy?” or the National Bureau of Economic Research (NBER).
3. Bank credit is a much smaller share of overall credit in the economy today than it was during the Great Depression. Many large firms borrow directly in the financial markets today, issuing longer-term debt or short-term commercial paper, as two examples, rather than borrowing through banking intermediaries. Historical Flow of Funds data from the Federal Reserve Board show the dramatic reduction in the share of bank lending to total lending in the U.S. economy. In the 1950s, when the Flow of Funds data were first reported banks accounted for close to 90 of all lending. In contrast, from 2007 to 2012 commercial banks only accounted for about 45 percent of total lending. See the Federal Reserve Board’s Z.1 Statistical Release, Flow of Funds website.
4. Semiannual June and December loan data for All Commercial Banks are available from 1923 to 1946. These nominal data are used to create the annual loan total and annual loan growth rate series shown in Figure 2. Data plotted are December loans from the Federal Reserves’s Banking and Monetary Statistics, 1914-1941, published by the Board of Governors of the Federal Reserve System, August 1976. See Table No. 3. – All Commercial Banks—Number, Loans, Investments, and Deposits, 1914-1941, page 19.
5. For the Great Depression, the peak annual 1929 loan total used is the fourth quarter of 1929, this is the quarter that included the October 1929 stock market crash. For the Great Recession, the peak quarterly loan total used is the third quarter of 2008, the period that included the failure of several major financial institutions in September 2008.
6. Quarterly data series generated from monthly data, End of Period (EOP). Data are collected by the Federal Reserve and published in the H.8 Release, Assets and Liabilities of Commercial Banks in the United States. Nominal loan data are available monthly starting in 1947. For the analysis here, end of quarter loan totals (generated from the quarterly bank Call and Income Reports collected by the banking regulatory agencies) are used to create the Great Recession lending index series shown in Figure 2.
7. Since early 2011, the Federal Reserve’s Senior Loan Officer Opinion Survey on Bank Lending Practices has generally been reporting increased demand for several types of loans, including commercial, commercial real estate, and auto loans.
8. The increase in this measure early in the Great Depression reflects the more rapid declines in Gross Domestic Product (GDP) than in bank loans.