
For decades, economists and policymakers have argued about the meaning of full employment. Those debates are getting more vigorous. Historic changes in labor force growth have resulted in a job count that is barely rising and a labor market that feels static, even stuck—a significant departure from the usual experience of full employment.
This presents several challenges for monetary policy—both for calibration and communication. These challenges are likely to intensify as U.S. demographic trends continue to unfold.1
So how did we get here? Figure 1 tells the story. It plots U.S. labor force growth over the past half-century. Labor force is defined as the number of people in the civilian population aged 16 and older working or looking for work.
The shift has been significant, from a period of booming growth in the 1970s to steady moderation, to the near-zero-growth state we are in today.
Figure 1. Annual growth in civilian labor force
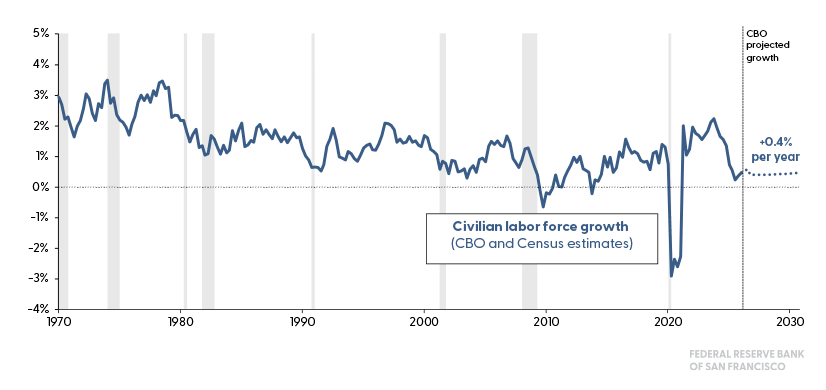
These dynamics reflect an array of factors—the life cycle of the baby boom, falling birth rates, changes in labor force participation of men and women, and changes in immigration.2 During the 1970s, labor force growth was consistently high, often exceeding 2 percent to 2.5 percent annually. This was driven by the baby boom generation aging into their prime working years and women entering the labor force in historic numbers.3 As the baby boomers aged, smaller generations followed, and female labor force participation stabilized, labor force growth fell, averaging 0.6 to 1.2 through the 1990s-2010s. Absent immigration, these numbers would have been even lower in some years.
The current period looks quite different. Over the past few years, labor force growth has moved towards zero. Without increases in immigration, the labor force is projected to shrink over the coming decade.4
Slower labor force growth means that traditional “rules of thumb” for labor market health are changing. When labor force growth was one to two or more percent, zero job growth in any month set off alarm bells, signaling a potential recession. But with labor force growth near zero, a “zero” or even a negative month of net job gains could be consistent with expectations and not necessarily a sign of weakness. Simply stated, slower labor force growth translates into lower benchmark job gains.
Figure 2 highlights this point. It plots the six-month moving average of nonfarm payroll job gains (thousands of jobs) and an estimate of the breakeven level—the number of jobs needed to absorb new and reentering workers and hold the unemployment rate steady. As labor force growth has slowed, the level of benchmark jobs has fallen. Current experience is consistent with this point. While job growth has fallen from an average of 166 thousand jobs per month in 2023 and 2024 to about 17 thousand jobs since the middle of 2025, the unemployment rate has risen only slightly.
Figure 2. Nonfarm payroll employment growth and breakeven growth estimate
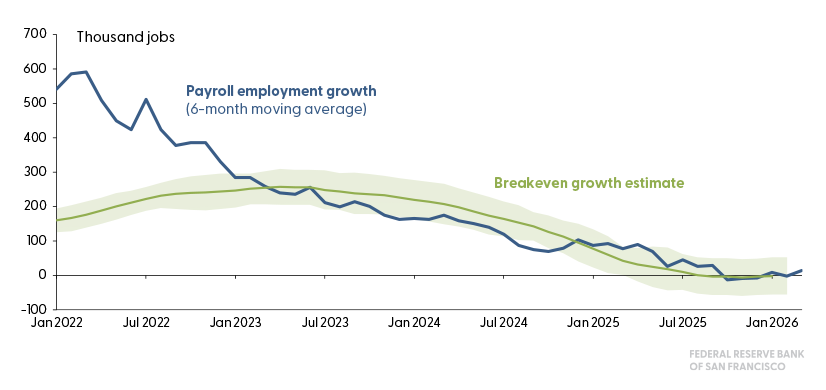
Source: Bureau of Labor Statistics and Cheremukhin, Wilson, and Zhou (2026)
So, what does this mean for monetary policy? First, job growth alone is unlikely to be a good metric of labor market strength or weakness. Ratios and rates like the employment-to-population ratio, the unemployment rate, the quits rate, or the hiring rate, which account for changes in the size of the labor force, can provide a clearer picture of labor market health.5
Second, with a limited number of new workers entering the labor force, the speed limit of the labor market will likely be different. Productivity growth can make up some of the difference, but absent rapid and sustained gains, the growth rate of the U.S. economy will be slower. Given the historic difficulty of accurately predicting sustained changes in productivity growth, uncertainty around potential growth of the economy will rise. This can increase the risk of making a policy miscalculation, holding conditions too loose or too tight for the evolution of the economy.
Third, communication will be harder. Conveying that a zero-job growth economy is consistent with full employment is not easy. The plentiful and dynamic labor market that has dominated much of recent history will likely feel distant. And with inflation already printing above target, policymakers will have to be very clear about how movement towards our mandated goals will be achieved.
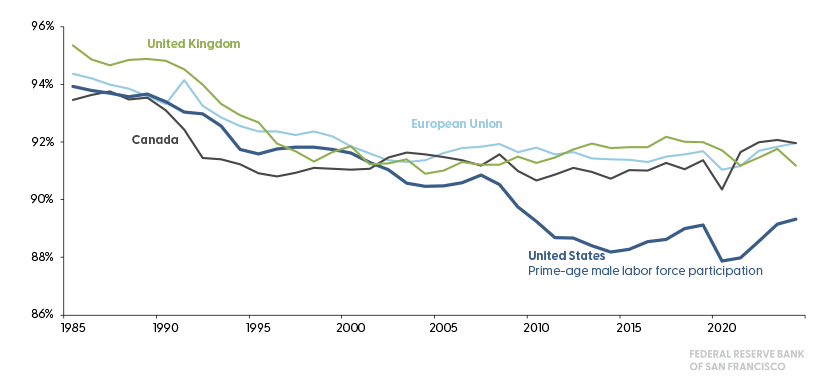
But these will not be the only challenges. Policymakers will also need to be open to the possibility that things could change. Since the Global Financial Crisis, labor force participation of men 25-54 in the U.S. has remained low relative to other countries. In particular, the participation of prime-age men has lagged relative to most other industrialized nations. Many of the barriers that have contributed to this gap are beyond the levers of monetary policy. Still, history tells us that prime-age men respond positively to strong labor market conditions, and as the figure shows, they have considerable room to improve their contribution, should economic growth be sustained. All this means that we must remain open to the idea that economic conditions matter, and that in periods of sustained growth, participation rates can rise.6
Figure 3. Labor force participation rate, prime-age males
Footnotes
1. The Congressional Budget Office (2026a) projects that labor force growth will average 0.4 percent per year over the coming decade, primarily reflecting the aging of the population. In addition, they project a decline in the labor force participation rate owing to the retirement of members of the baby boom generation and Generation X.
2. For more information, see Duzhak and New-Schmidt (2025) and Bengali et al. (2025).
4. For example, in the latest Congressional Budget Office (2026b) demographic outlook report, the agency projects that without immigration, U.S. population would begin to shrink in 2030 as declining fertility rates cause the annual number of deaths to exceed the annual number of births. See also Duzhak and New-Schmidt (2025) for the impact of different immigration scenarios on prime-age labor force growth.
5. Examples of how different indicators reflect the strength or weakness of the labor market are discussed in Bok et al. (2022), Barnichon and Shapiro (2022), and Restrepo-Echavarría and Bass (2025).
6. See Bengali et al. (2025) and Baskar Prabhakar and Valletta (2024) for more information.
References
Barnichon, Regis, and Adam Shapiro. 2022. “What’s the Best Measure of Economic Slack?” FRBSF Economic Letter 2022-04 (February 22).
Baskar Prabhakar, Deepika, and Robert G. Valletta. 2024. “Why Is Prime-Age Labor Force Participation So High?” FRBSF Economic Letter 2024-03 (February 5).
Bengali, Leila, Mary C. Daly, Evgeniya A. Duzhak, and Cindy Zhao. 2025. “Pulled Out or Pushed Out? Declining Male Labor Force Participation.” Federal Reserve Bank of San Francisco Working Paper 2025-07.
Bok, Brandyn, Nicolas Petrosky-Nadeau, Robert G. Valletta, and Mary Yilma. 2022. “Finding a Soft Landing Along the Beveridge Curve.” FRBSF Economic Letter 2022-24 (August 29).
Cheremukhin, Anton, Daniel Wilson, and Xiaoqing Zhou. 2026. “Break-Even Emplyoment Declines as Unauthorized Immigration Outflows Continue.” Dallas Fed Economics, Federal Reserve Bank of Dallas (March 31).
Congressional Budget Office. 2026a. The Budget and Economic Outlook: 2026 to 2036. February.
Congressional Budget Office. 2026b. The Demographic Outlook: 2026 to 2056. January.
Daly, Mary C. 2007. “Labor Force Participation and the Prospects for U.S. Growth.” FRBSF Economic Letter 2007-33 (November 2).
Duzhak, Evgeniya, and Addie New-Schmidt. 2025. “Immigration and Changes in Labor Force Demographics.” FRBSF Economic Letter 2025-28 (November 19).
Restrepo-Echavarría, Paulina, and Mickenzie Bass. 2025. “The Beveridge Curve’s Predictive Power: Why Job Vacancy Types Matter for Monetary Policy.” On the Economy Blog, Federal Reserve Bank of St. Louis (November 18).
The views expressed here do not necessarily reflect the views of the management of the Federal Reserve Bank of San Francisco or of the Board of Governors of the Federal Reserve System.