

Households can lose spending power if they suffer job losses during recessions or when the cost of living rises at times of high inflation. One way to assess the historical roles these two factors have played in eroding economy-wide earnings is by breaking down the cumulative growth in inflation-adjusted household earnings into three components: nominal earnings growth, inflation, and employment growth. Analyzing the results suggests that periods of high inflation may undermine economy-wide real earnings growth more than mild recessions.
The COVID-19 pandemic devastated millions of lives and disrupted economies around the globe. Since then, many economies have faced another problem—high inflation. To lower U.S. inflation, the Federal Reserve substantially tightened monetary policy beginning in early 2022. While this policy shift was aimed to reduce inflation, it also raised some concerns about the risk of slowing the economy into a recession. The potential tradeoff has renewed the debate over which is more costly—prolonged periods of inflation or recession. Both have negative economic effects, although the impact across households is uneven, depending on their economic circumstances (Schwartzman 2023).
In this Economic Letter, we focus on the overall cost to households using a measure of total real earnings (TRE), which tracks the combined inflation-adjusted labor income earned by everyone in the U.S. economy. This allows us to directly compare aggregate costs across past periods of recession and high inflation.
We assess the costs of high inflation and unemployment by breaking down changes in TRE into three components—nominal wage growth, inflation, and employment growth—for historical periods of high inflation and moderate to severe recessions. While people usually associate large economic losses with recessions, high inflation can also have substantial costs, and we find that these losses can exceed those incurred during mild recessions. For instance, when inflation was high in the late 1970s and early 1980s, cumulative TRE fell slightly. By contrast, over the six quarters following the start of the 2001 recession, cumulative TRE grew, driven by real wage increases. The 2020 recession was quite different. Cumulative TRE initially declined before reversing course in 2021 due to strong job gains, even though high inflation eroded real wages. This analysis underscores the importance of looking at both inflation and employment growth when assessing the economic costs of macroeconomic events.
Measuring total real earnings growth
To compare economic outcomes between different periods of time, economists often use the concept of total welfare, which accounts for costs and benefits across all individuals in the economy. In the context of recessions and inflationary periods, the costs could reflect long-term reductions in earnings (Schmieder, von Wachter, and Heining 2023), reemployment in lower-paying jobs (Huckfeldt 2022), reduced work hours (Birinci and Ngan 2023), as well as the loss of jobs and earnings and the erosion of real purchasing power. At the same time, those who keep their jobs could benefit from rising real wages.
For this Letter, we create a proxy for total welfare using a simple measure of total real earnings, or TRE, calculated as inflation-adjusted earnings multiplied by total full-time employment. Specifically, we adjust median weekly earnings to 2012 dollar values using the personal consumption expenditures (PCE) price index. Incorporating these costs into the measure makes it simpler to separately identify them in our later analysis.
Using a measure made up of a real earnings margin and an employment margin is useful because we can see what drives changes in TRE in different periods of time. This simple statistic can be used to examine the tradeoff between unemployment and inflation. One weakness of using TRE as a proxy for welfare is that it abstracts from the demographic composition of the worker pool, which sidesteps issues of inequality. It also abstracts from preferences about hours worked each week. Additionally, this measure puts equal welfare weight on changes in TRE due to job loss and those due to inflation eroding workers’ purchasing power. This means that job losses by a few workers could have the same cost in the overall measure as real wage declines driven by inflation for a potentially larger group of workers.
Breaking down TRE to study inflation and recessions
The simplicity of our measure allows us to study the impact of changing prices and employment by separating TRE growth into components for employment growth, which can also be shown as changes in the unemployment rate, and real earnings growth. We further break down real earnings growth into nominal earnings growth and inflation.
Figure 1 shows the components of TRE growth over time. The bars show that earnings, inflation, and employment fluctuate differently depending on economic conditions. The employment component (green bars) depicts how much a strong labor market can contribute to TRE growth. Likewise, employment subtracts from TRE growth during recessions when the unemployment rate increases. Nominal earnings (yellow bars) capture labor demand and contribute positively to TRE growth. The nominal earnings component does not show how much workers’ purchasing power changes, which is important for determining welfare; this is why we include an inflation component (blue bars). Since positive inflation values reduce the spending power of worker income, this component subtracts from TRE growth in the figure. This has a much larger impact when inflation is high, as in the early 1980s and after the 2020 recession. As Figure 1 demonstrates, inflation tends to decrease during recessions.
Figure 1
Components of annual total real earnings (TRE) growth
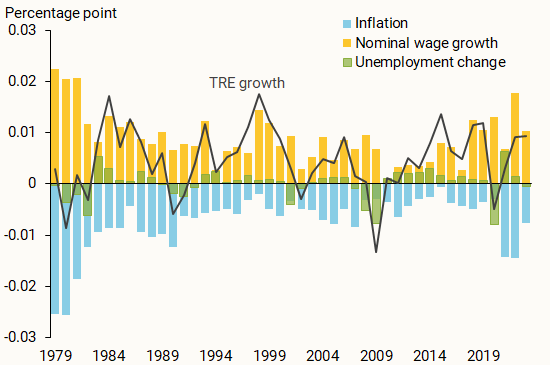
Generally, inflation tends to erode TRE growth more than changes in employment, except during severe recessions. At the same time, nominal wages tend to grow faster in periods of high inflation, somewhat offsetting the purchasing power that is lost due to inflation. Therefore, the overall changes in TRE (black line) depend on the interaction of growth in employment, inflation, and nominal wages.
Comparing TRE growth across historical episodes
To gauge the impact of recession and inflation on TRE, we compare changes in its three components across historical episodes. The past five decades included several periods of high inflation and seven economic downturns (Figure 2). The most prominent example of high inflation was the period from the late 1970s to early 1980s, when oil shocks sent energy prices soaring, pushing PCE inflation close to 12%. In addition to the recent period of elevated inflation during the recovery from the 2020 recession, other examples include a short period in 1990, when inflation reached 5%, and the Great Recession of 2007–09, when inflation reached about 4%.
Figure 2
PCE inflation and the unemployment rate
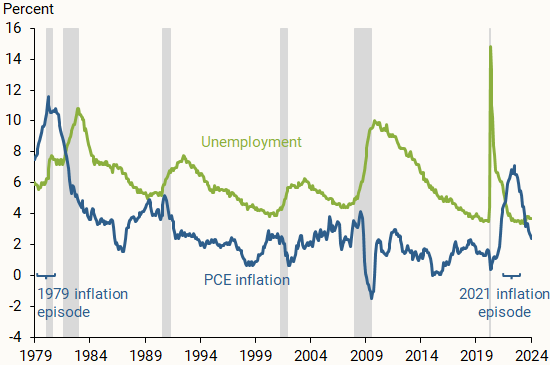
To study the impact of high inflation alone, we focus as much as possible on months that did not overlap with recessions, specifically two episodes starting in the first quarter of 1979 and the second quarter of 2021, as shown in the figure. Though the end of the earlier period overlaps with a recession, the changes in TRE are dominated by inflation rather than recession. Additionally, we consider four recessions with varying severities of job loss, marked with gray shading in 1990, 2001, 2007–09, and 2020.
We summarize growth in TRE and its components across historical episodes by aggregating six quarters of cumulative growth. For example, in the 2001 recession we calculate growth between the first quarter of 2001 and each of the subsequent six quarters and then add up these growth rates. This captures the extra wages earned by all workers in the economy relative to the beginning of each six-quarter period and accounts for the incremental changes in TRE that would be missed by comparing only the first and last values of each episode.
Figure 3 breaks down cumulative TRE growth (yellow diamonds) into contributions from gains or losses in employment (green bars) and real earnings (blue bars) for our selected periods of inflation and recession. Positive values indicate gains, while negative values indicate losses relative to the indicated reference date.
Figure 3
Components of cumulative total real earnings growth
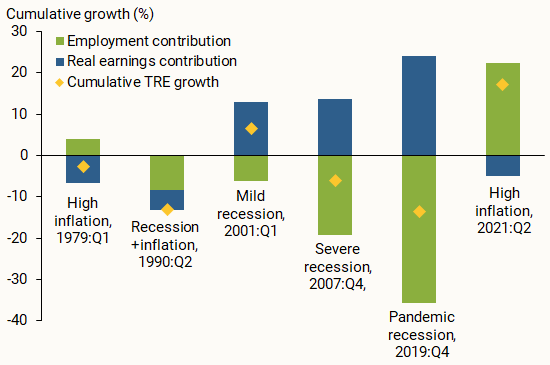
Source: Bureau of Labor Statistics, Bureau of Economic Analysis, and authors’ calculations.
Cumulative TRE changes range from negative 14% to positive 17%, with the largest declines during the 1990 and 2020 recessions and the biggest gains during the 2021 inflationary episode. The impact of inflation and employment growth on aggregate earnings varies by episode.
During periods of high inflation, such as the 1979 episode, a large portion of TRE growth was eroded by a loss of purchasing power. This is reflected by the fact that growth in nominal wages did not keep up with inflation, as the negative values for real earnings in Figure 3 show (blue bars).
In contrast, the main factor pushing TRE down during the next four recessions is falling employment (green bars). The degree of the impact depends on the severity of the recession. During the two most severe recessions in 2007–09 and early 2020, cumulative employment declines reached a staggering 19% and 36%, respectively, compared with 8% and 6% in the 1990 and 2001 recessions, respectively.
However, overall cumulative TRE growth depends on both real earnings and employment growth. Figure 3 suggests that TRE tends to decline when inflation is high and during severe recessions. During high inflation, the force driving TRE declines is lost real earnings; during severe recessions, the main driver is significant job losses. For example, in the inflationary episode of 1979, TRE losses due to the erosion of real earnings via inflation reached almost 7%, which exceeded TRE gains due to employment growth. Therefore, cumulative TRE growth decreased on net. On the other hand, strong employment losses during the Great Recession and the 2020 pandemic recession more than offset gains in real earnings for those remaining employed. As a result, after six quarters, cumulative TRE growth plunged 6% and 14%, respectively. In the 1990 recession, employment losses and rising prices compounded, resulting in significant TRE losses, similar to those in the 2020 pandemic.
It is instructive to directly compare the components that bring down TRE growth (the negative bars) across different periods. In the 1979 episode, TRE losses due to inflation reached about 7%, which is somewhat larger than TRE losses due to employment reductions in the 2001 mild recession, about 6%, and somewhat smaller than TRE losses due to employment declines in the 1990 recession, about 8%. Substantial employment losses during severe recessions far outweigh lost real earnings during inflationary episodes. On net, the largest declines in TRE growth occurred during severe recessions and when a recession accompanied high inflation.
Conclusion
Moderating high inflation by increasing interest rates can come at the risk of job losses. Rising unemployment erodes earnings and economic well-being through job losses, while high inflation may do the same through declines in real earnings when nominal earnings do not keep pace with price inflation. In this Letter, we quantify the cost of high inflation and rising unemployment by measuring cumulative changes in total real earnings (TRE) across six historical episodes with varying degrees of inflation and job losses. While people usually associate large economic losses with recessions, high inflation can also have substantial costs, and we find that these losses can exceed those incurred during mild recessions. The most recent inflationary episode of 2021 was coupled with a very strong post-pandemic labor market recovery, tipping the scale to the side of TRE gains. This analysis underscores the importance of looking at losses caused by both inflation and unemployment when assessing overall economic costs.
References
Birinci, Serdar, and Trȃn Khánh Ngȃn. 2023. “Deconstructing Hours Worked: How Did Recent Recessions Differ?” FRB St. Louis, On the Economy Blog (August 1).
Huckfeldt, Christopher. 2022. “Understanding the Scarring Effect of Recessions.” American Economic Review 112(4), pp. 1,273–1,310.
Schmieder, Johannes F., Till von Wachter, and Jörg Heining. 2023. “The Costs of Job Displacement over the Business Cycle and Its Sources: Evidence from Germany.” American Economic Review 113(5), pp. 1,208–1,254. Schwartzman, Felipe. 2023. “Trade-offs in Fulfilling the Fed’s Dual Mandate.” FRB Richmond, Economic Brief 23-08 (March).
Opinions expressed in FRBSF Economic Letter do not necessarily reflect the views of the management of the Federal Reserve Bank of San Francisco or of the Board of Governors of the Federal Reserve System. This publication is edited by Anita Todd and Karen Barnes. Permission to reprint portions of articles or whole articles must be obtained in writing. Please send editorial comments and requests for reprint permission to research.library@sf.frb.org