
The Federal Reserve tightened monetary policy rapidly between 2021 and 2023. In addition, a weekly proxy federal funds rate shows that markets perceived the policy stance as tightening significantly even in weeks without explicit policy changes. The proxy rate uses financial market data to infer the broad stance of monetary policy as determined by funds rate changes, forward guidance about projected future rates, and balance sheet changes. Results show that the weekly proxy rate can capture changes that reflect both policy tools and market reactions to changing economic news.
The Federal Open Market Committee (FOMC) rapidly tightened the stance of monetary policy between late 2021 and the middle of 2023, raising the target range for the federal funds rate from 0–¼% to 5¼–5½% and continually signaling its intentions for future rate increases along the way. It also changed the Federal Reserve’s balance sheet, moving from a rapid expansion of asset purchases that began in 2020 to slowing those purchases in late 2021, to ultimately reducing its holdings in the middle of 2022. The FOMC described these combined actions as a response to a strong economy with low unemployment and with inflation that rose sharply before receding back towards the FOMC’s 2% inflation goal.
These multiple forms of monetary tightening—federal funds rate shifts, forward guidance for future policy, and balance sheet changes—make it challenging to assess the full stance of monetary policy, meaning how restrictive or accommodative it is for economic growth. However, looking at financial indicators can help in measuring this stance because financial markets transmit the effects of monetary policy to the rest of the economy. Financial indicators also respond to expectations for future policy, so they can provide further insights into whether market responses are associated with actual FOMC actions or are a reaction to incoming economic news and anticipated FOMC actions.
In this Economic Letter, we expand the proxy funds rate (Doh and Choi 2016 and Choi, et al. 2022) from a monthly to a weekly frequency to study the anatomy of the recent tightening cycle. The weekly proxy funds rate incorporates how financial variables typically correlate with the monetary policy stance to measure financial market perceptions of the policy stance at any point in time. We examine how weekly movements in the proxy rate relate to both observed monetary policy actions and major economic data news.
We find that the expected stance of policy changes frequently and often substantially from week to week. Between May 2021 and July 2023, most of the cumulative tightening in the proxy rate occurred outside of weeks with explicit policy changes, and during weeks with inflation and employment data releases. The stronger response to data news is consistent with markets anticipating how the FOMC will react to incoming data.
A weekly proxy funds rate
We follow the methodology of Doh and Choi (2016) and Choi et al. (2022) to expand the monthly proxy funds rate to a weekly frequency. The weekly measure uses the same broad financial conditions—several Treasury rates, mortgage rates, municipal bond rates, corporate borrowing rates, and interest rate spreads—but takes weekly rather than monthly averages of higher frequency data series.
The proxy rate aligns closely with levels of the federal funds rate before mid-December 2008. After that, the Fed began actively using new policy tools beyond changing the federal funds rate. When financial markets respond to alternative tools such as forward guidance or balance sheet operations, the proxy funds rate moves separately from the federal funds rate. The proxy rate can thus be interpreted as indicating what federal funds rate would typically be associated with contemporaneous financial market conditions if the funds rate were the only monetary policy tool being used.
Figure 1 shows recent movements in the federal funds rate, the monthly proxy funds rate, and the new weekly proxy funds rate. From late 2021 through early 2024, both proxy funds rates exceeded the actual federal funds rate. Choi et al. (2022) point to balance sheet policy and forward guidance as driving this wedge. In the second half of 2023, the gap between the proxy rate and the funds rate narrowed, consistent with markets beginning to expect funds rate increases to end and eventually reverse.
Figure 1
Effective federal funds rate and proxy funds rates
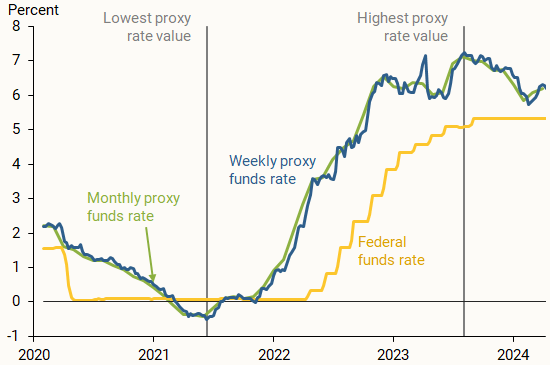
Comparing the proxy rate at weekly and monthly frequencies shows that these measures generally move together. By definition, the weekly rate moves more often, with smaller or larger changes than the monthly measure. A notable large move was the rapid increase and subsequent decline in early 2023, coinciding with a period of banking stresses and hence likely reflecting temporary financial stability concerns. The weekly rate also allows us to date when, through the lens of financial markets, monetary policy began and ended tightening. We identify the week of May 14, 2021, as the week when the tightening cycle began, as the weekly proxy funds rate began rising from a level of –0.5%. After a rapid tightening, the weekly proxy funds rate topped out at 7.22% in the week of July 7, 2023, and has since declined from that peak.
Tracking changes in the weekly proxy funds rate
An advantage of tracking the monetary policy stance weekly is that we can identify whether changes in the proxy funds rate occurred during weeks with important news about monetary policy or the macroeconomy.
Figure 2 shows the weekly change in the proxy funds rate, with bars colored to indicate major monetary policy or macroeconomic news during that week. For monetary policy, we track FOMC meetings (dark blue bars), releases of FOMC minutes (green bars), and major speeches or Congressional testimony by Chair Jerome Powell (yellow bars), which have been shown to influence financial markets by reflecting expectations about the path of monetary policy (Swanson and Jayawickrema 2023).
Figure 2
Changes in the weekly proxy funds rate: 2021–2023 tightening cycle
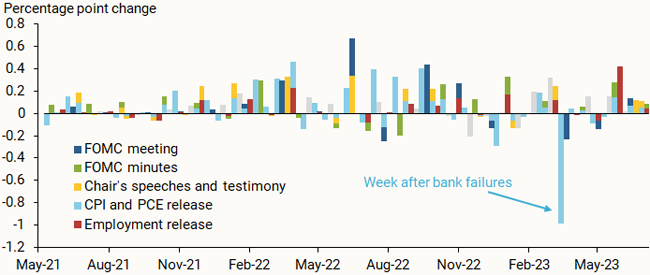
For macroeconomic news, we consider weeks with data releases on inflation (light blue bars)—both the consumer price index (CPI) and personal consumption expenditures (PCE) index—and data about employment (red bars). Some weeks have two or three policy or news events, and we are unable to determine the relative importance of each event, so we simply break the bars into equal portions. Finally, gray bars indicate weeks with none of these events.
The first takeaway from Figure 2 is that the proxy rate varies significantly across the tightening cycle. Over the 112 weeks in the sample, there are 74 weeks with increases and 21 weeks with decreases of more than 0.05 percentage point. FOMC events typically move the target federal funds rate in larger increments of 0.25 percentage point, and there are 18 weeks with increases and 1 week with a decrease of at least this size. Since actual federal funds rate changes occurred only 10 times, the remaining larger changes illustrate that financial markets perceive much more frequent movements in the expected stance of monetary policy.
A second takeaway from Figure 2 is that monetary tightening occurred with both monetary policy news and macroeconomic news. Weeks with FOMC meetings, FOMC minutes releases, or major Chair speeches or testimony often had sizable changes in the proxy rate. These changes can be traced to explicit changes in monetary policy through changes in the interest rate or balance sheet policy during FOMC meetings or information about the future evolution of policy revealed in post-FOMC statements, the Chair’s press conferences, the FOMC minutes, or the Chair’s public remarks. We also see significant movement in the proxy rate during weeks that had news releases about inflation or employment—reflecting the dual mandate goals of the FOMC.
What were the sources of monetary policy tightening?
To better understand the relationship between the policy stance and weekly information developments, Figure 3 shows the cumulative change in the proxy rate by category of week, plus the number of weeks in each category and the average change per week. For example, we identify 17 weeks with an FOMC meeting and compute the cumulative change in the proxy rate in those weeks. We repeat this calculation for weeks with FOMC minutes, the Chair’s public remarks, and inflation or employment releases. Because a given week can fall into more than one category, the sum of the bars exceeds the total change in the proxy rate. We omit the week of March 12–18, 2023, which contained a CPI release but also exhibited extreme financial volatility following banking stresses.
Figure 3
Cumulative changes in proxy rate by week events
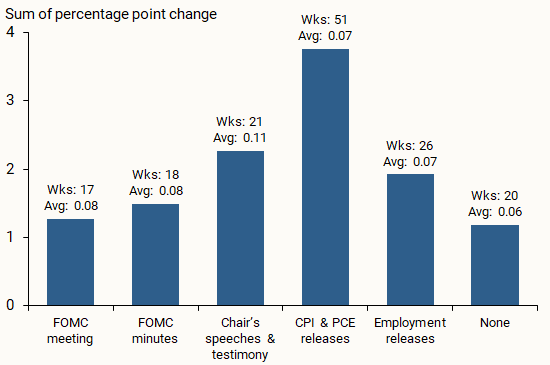
The bars in Figure 3 indicate that a substantial amount of tightening occurred outside periods with explicit changes in policy. The proxy rate tightened only 1.28% during weeks of FOMC meetings, far less than both the increase in the federal funds rate and the total increase in the proxy rate of 7.72% over this period. Weeks with minutes releases or public remarks by the Chair showed a significant amount of tightening. The Chair’s remarks resulted in higher average changes than the other two categories. This is consistent with the view that information about future policy conveyed by the minutes or especially by the Chair—aspects of forward guidance—can be priced into financial conditions immediately, leading to a change in the policy stance even without explicit policy action.
Nonetheless, a substantial amount of the tightening in the proxy rate occurred outside of weeks with significant monetary policy news. Most of the cumulative increase in the proxy rate occurred in weeks with important CPI, PCE, and employment releases, in part because these weeks outnumber other categories. However, the average change during these weeks was on par with movements during policy news weeks. This indicates that financial markets internalized how the FOMC would respond to economic news—known as its reaction function—and responded to new information in anticipation of future policy changes. For example, the changes suggest that, when the CPI release came out indicating accelerating inflation, markets responded in a way that was consistent with them expecting future FOMC policy tightening. This type of movement reflects a monetary policy environment where the FOMC has been transparent and is credible about how it will tend to react to incoming information.
Conclusion
The FOMC rapidly tightened monetary policy between 2021 and 2023. As described in this Letter, the proxy funds rate captures the stance of policy during this time through financial markets, which respond to all policy tools including forward guidance and changes in the balance sheet. By expanding the monthly measure to a new weekly proxy funds rate, we find frequent and often sizable movements in the stance of monetary policy. A significant amount of policy tightening occurred during weeks without explicit monetary policy news, as markets responded to macroeconomic news, likely in anticipation of subsequent FOMC policy reactions to the new data.
References
Choi, Jason, Taeyoung Doh, Andrew Foerster, and Zinnia Martinez. 2022. “Monetary Policy Stance Is Tighter than Federal Funds Rate.” FRBSF Economic Letter 2022-30, November 7.
Doh, Taeyoung, and Jason Choi. 2016. “Measuring the Stance of Monetary Policy on and off the Zero Lower Bound.” FRB Kansas City Economic Review 101(3), pp. 5-21.
Swanson, Eric, and Vishuddhi Jayawickrema. 2023. “Speeches by the Fed Chair Are More Important Than FOMC Announcements: An Improved High-Frequency Measure of U.S. Monetary Policy Shocks.” Unpublished manuscript.
Opinions expressed in FRBSF Economic Letter do not necessarily reflect the views of the management of the Federal Reserve Bank of San Francisco or of the Board of Governors of the Federal Reserve System. This publication is edited by Anita Todd and Karen Barnes. Permission to reprint portions of articles or whole articles must be obtained in writing. Please send editorial comments and requests for reprint permission to research.library@sf.frb.org