Every October the Federal Reserve conducts an annual payment study, the Diary of Consumer Payment Choice (Diary), to better understand payment trends and habits of the U.S. population.1 This year’s Diary was conducted seven months into the COVID-19 pandemic. Given the timing of the study, the analysis shows some significant changes in consumers’ payment behavior, though it is unclear if any of these changes will persist once the pandemic has ended. As with previous Diary studies, a demographically representative sample of adults from the Understanding America Study panel were asked to participate.2 There were 1,537 participants who took part in the 2020 Diary study. Each participant was instructed to report all their transactions, including cash withdrawals and deposits, over an assigned, consecutive three-day period. All transactions are then aggregated and, unless otherwise noted, reported on a monthly, per-person basis. The high-level findings from this year’s Diary study are:
U.S. consumers made an average of 34 payments in October 2020, down from 39 in 2019
Cash use accounted for 19 percent of all payments, down seven percentage points from 2019
Small-value payments, defined as transactions under $25, declined by 26 percent
Total value spent increased from $4,236 to $4,760
Average value of cash held in consumers’ pocket, purse, or wallet increased to $74, up $20 from 2019
Approximately 72 percent of U.S. consumers reported making an in-person payment over their three-day reporting period, down from 91 percent in 2019
Total spending on not-in-person, non-bill payments increased substantially at grocery stores, dining establishments, and general merchandise locations
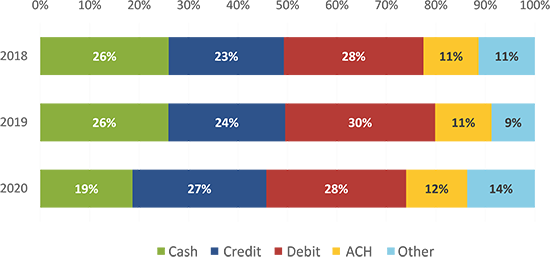
As noted in the April and August supplemental Diary papers, consumer payment behavior changed dramatically and the pandemic continues to affect how consumers shop.3 Total payments in 2020 declined approximately eleven percent, or four total payments, compared to last year. Of the 35 total payments made in 2020, cash, debit card, and credit card payments accounted for approximately 19 percent, 28 percent, and 27 percent, respectively.
The decline in total payments in 2020 was mostly due to a decrease in the number of small-value payments under $25, which declined by approximately four payments per month. This change disproportionately affected the number of cash payments, which have historically accounted for most payments under $25. In 2020, consumers reduced the number of small-value cash payments by more than 40 percent compared to 2019, a decrease of three cash payments per month.
As a result of the pandemic, the share of people reporting at least one in-person payment during the Diary period dropped to 72 percent, a 19-percentage point decline compared to the 2019 Diary. While not directly comparable, supplemental surveys conducted in April and August found the number of consumers making in-person payments dropped sharply in April and began to increase throughout late spring and early summer.4
As online shopping increased, the average number of not-in-person payments made to grocery stores, dining establishments, and general merchandise stores increased slightly by approximately one payment per person. However, the total value of not-in-person spending per person at these merchant types increased substantially, doubling from approximately $110 in 2019 to $212 in 2020.
The paper consists of four sections, with each section exploring various aspects of cash use during the pandemic. Section 1 details changes in payment trends, including the share of individuals making in-person payments, payment instrument use for not-in-person payments, and the share of payment instrument use by purchase amount; Section 2 discusses how age and stated payment preferences influence payment use; Section 3 explores cash holdings by demographic cohort; and Section 4 outlines in-person and not-in-person payment use by merchant type. Appendix A provides an overview of the methodology. Additional information about the 2020 Diary is available at the website of the Federal Reserve Bank of Atlanta.5
Note Regarding COVID-19
While the paper highlights changes in payment behavior that may be accelerated by the pandemic, it is still unknown whether these changes will be transitory or permanent in the long run. The Diary data is examined for year-to-year comparisons of payment behavior, and the authors acknowledge that payment behavior has changed throughout this pandemic. Therefore, the Cash Product Office and Federal Reserve of Atlanta sought to capture data on changing payment practices during the pandemic through a series of supplemental surveys, conducted in April and August of 2020. The findings from these two supplemental studies were published in two separate papers and highlighted important changes in payment behavior observed during the pandemic. The first supplemental paper describes changes in cash holdings, changes in choice of payment instrument, and cash avoidance. The second supplemental paper discusses in-person shopping behavior, consumer’s experience with the coin shortage, and consumer cash holdings.
Acknowledgements
This paper would not have been possible without the support and contributions of the following individuals. From the Atlanta Fed: Kevin Foster, Claire Greene, Marcin Hitczenko, Brian Prescott, and Oz Shy. From the Boston Fed: Joanna Stavins and Ruth Cohen. From the San Francisco Fed: Tom Flannigan, Simon Kwan, and Justin Wray. From the Cash Product Office: Lauren Brown, Alexander Bau, Benjamin Gold, Jamie Law, Kelly McGuire, Margaret Riley, Louise Willard, Kathleen Young, and Roger Replogle.
Section 1. Trends in Cash Usage
Total number of transactions and share of cash usage declined during the pandemic
The COVID-19 pandemic changed many aspects of life in 2020. How U.S. consumers made payments is no exception. Given the nature of the coronavirus, consumers limited in-person activities due to the fear of infection and governments enacted shelter-in-place orders and restrictions, many of which remained in place throughout the fall. Thus, the way people engaged in purchases and payments shifted significantly in 2020. In April and August, the Cash Product Office and Federal Reserve Bank of Atlanta conducted two short surveys to quickly gauge how consumers were paying during the pandemic. This year’s Diary provides a more detailed insight into consumer payment behavior and trends during the pandemic.
In October of 2020, U.S. consumers reported making an average of 34 payments per monthdown from 39 payments in 2019. Despite the decline in the number of payments, consumers’ monthly spending increased to an average of $4,760 in 2020, up from $4,236 in 2019 and $3,999 in 2018.6 This suggests consumers consolidated their purchases into fewer transactions, combining transactions for multiple products at one store or on one platform.
Cash’s share of all payments decreased by seven percentage points in 2020 (Figure 1), a larger decline than experienced in any category over the past two years. Meanwhile, credit cards’ share of payments has increased since 2016, most recently increasing from 24 percent of payments in 2019 to 27 percent of payments in 2020. However, the increase in credit cards’ share of payments was primarily driven by a decrease in the use of other payment instruments rather than a direct increase in use of credit cards; the number of reported credit card payments remained steady from 2019 to 2020 at 9 payments per month. For the first time since the start of the Diary in 2016, credit cards’ share of payment instrument usage surpassed cash. Debit cards remained the most frequently used payment instrument, accounting for 10 of the 35 payments made, and a 28 percent share of payments.
Figure 2 shows the share of individuals making in-person payments over their three-day diary in 2020 (72 percent) was significantly lower than in 2019 (91 percent). The findings were higher than the results from the supplemental April or August survey, though the supplemental surveys asked whether any in-person payments took place over a longer period of time.7 The results from October 2020 are not surprising when compared to the results from the April and August surveys, given the easing of shelter-in-place orders and increasing comfort among consumers to conduct in-person payments as positive COVID-19 cases decreased from mid-summer to early fall.8
Figure 2
Share of Participants Reporting In-Person Payments During Diary
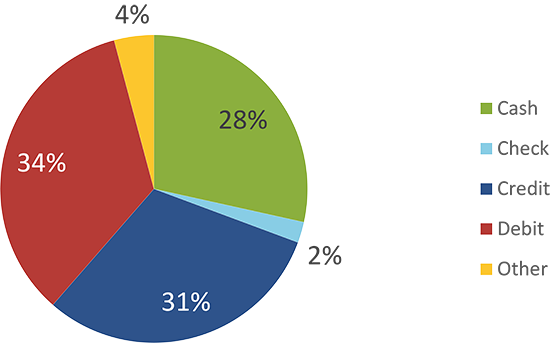
While the share of people making in-person payments declined in 2020 compared to 2019, most non-bill payments continue to be conducted in person. In each prior Diary study, cash was the most frequently used in-person payment instrument, accounting for 36 percent of in-person, non-bill payments in 2018 and 35 percent in 2019.9 At the onset of the pandemic, the share of debit and credit cards used surpassed cash as the share of cash use decreased seven percentage points from 2019 to 28 percent (Figure 3).10 While fewer consumers made in-person payments, those that did experienced a greater share of requests by merchants to not use cash. The second supplemental August survey found approximately 45 percent of those who shopped in person reported that merchants encouraged consumers to avoid using cash at least some of the time.11
Figure 3
Share of Payment Use for In-Person Non-Bill Payments
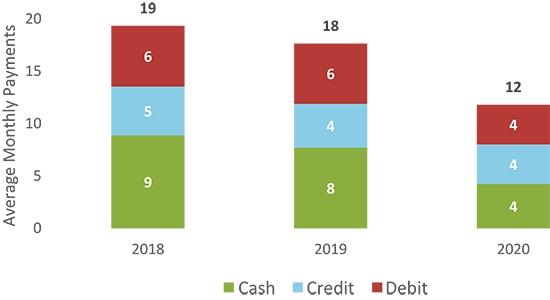
Between 2016 and 2019, cash use for small-value payments was declining as debit and credit cards’ share of small-value payments trended upward. While consumers who shopped in person experienced greater payment steering away from cash in 2020, the data suggest the decline in cash use was likely due to fewer total small-value payments, defined as payments of under $25, rather than a substitution of cash payments with cards. Consumers have traditionally used cash most frequently to make small-value payments and the decrease in the total number of small-value payments likely led to a decrease in the overall use of cash. Consumers reported making six fewer small-value payments, with four fewer cash payments and two fewer debit card payments. While substitution between cash and debit cards and credit cards likely took place, the main reason why cash and debit card use declined is due to the reduction in the total number of small-value payments.
Figure 4
Mean Monthly per Person Payments Under $25
The change in the payments landscape during the pandemic accelerated the shift in preferences from cash towards credit cards and debit cards, a trend which had been changing rather slowly over the five years prior to 2020. As with each annual Diary study, participants were asked to report the payment instrument they preferred to use for non-bill payments prior to their 3-day reporting period. In 2020, the share of individuals who preferred to use cash for non-bill payments declined by 5 percentage points compared to 2019. For comparison, cash preference declined four percentage points between 2016 and 2019. The decline in consumers stating a cash preference was offset by consumers stating a preference for credit and debit cards, which increased by 4 and 1 percentage points, respectively (Figure 5). These three instruments accounted for 94 percent of stated preferences and have accounted for at least 93 percent of stated preferences since 2016. Observed payment behavior continued to generally align with stated payment preferences, with participants continuing to make most of their payments with their preferred payment method.
Figure 5
Payment Instruments Preferred for Payment
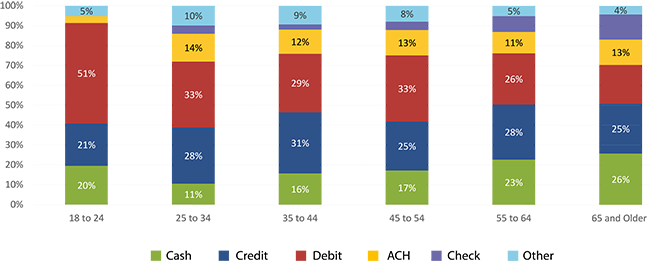
In contrast to prior years, the share of cash payments declined for every age group (Figure 6). This overall shift is not surprising given the role COVID-19 had in reducing the number of in-person payments, the only venue in which cash can be used for payments. Previously, the share of cash use has been consistently the highest among individuals aged 18 to 24 and those 65 and older (33 percent for both age cohorts in 2019) and lowest among those aged 25 to 34 (18 percent in 2019). While that pattern is still present, the share of cash use declined the most for individuals between 18 to 24 years old, by 13 percent year-over-year.
Figure 7 shows the share of payment instrument use for each age cohort. Cash was the third most used instrument behind debit cards and credit cards for all cohorts except those 65 and older. The share of debit and credit card use was roughly similar within each cohort except for the 18 to 24 old cohort. However, those 18 to 24 years old reported the largest year-over year decline in the share of cash used. This decline corresponds with a significant increase in the share of debit card use between 2019 to 2020. The simultaneous decline in the share of cash use and increase in share of debit card use within this cohort suggests cash payments may have been substituted with debit card payments. This is consistent with the findings from the 2019 Diary where cash-preferring consumers tended to use debit cards as a backup payment instrument at about twice the rate of credit cards. 12
All age and income groups increased cash holdings during the pandemic
As part of each annual Diary, participants are asked to report the amount of cash held in their pocket, purse, or wallet, which is referred to here as on-person cash holdings. These holdings are assumed to be used for payments rather than cash used as a store of value which is typically stored at one’s residence. This year, average on-person cash holdings increased for all adult age groups and household income levels. This a noteworthy shift from the consistent trend of consumers holding approximately $55 since 2016 (Figure 8).13 As reported in the August supplemental survey paper, the increases in average holdings may be explained by the continued uncertainty regarding the pandemic rather than being highly correlated to economic impact payments and federal supplemental unemployment insurance benefits.14
Individuals between the ages of 18 to 24, who previously held the least amount of cash on hand, almost doubled their daily holdings, from $33 to $60, since the start of the pandemic. In previous years, this age cohort tended to hold less on-person cash than their older counterparts. While on-person cash holdings increased across all cohorts when compared to 2019, age itself does not explain the increases over 2019. Consumers between 25 and 44 increased their average on-person cash holdings by less than $10 while those 18 to 24 and 55 to 64 increased holdings by $33 and $21, respectively. The pandemic caused the largest increase in the unemployment rate in recent U.S. history, climbing from 3.5 percent in February 2020 to 14.8 percent in April 2020, and left many Americans either furloughed or unemployed. Unemployment benefits from the COVID-19 relief bills are likely the cause for increased on-person holdings across age cohorts (Foster and Greene 2021, Atlanta Fed).15
Just as with age cohorts, cash held in consumers’ pocket, purse, or wallet increased significantly for households at all income levels. Generally, individuals from higher income households reported holding a greater amount of on-person cash than those from lower income households. Individuals living in households earning between $75,000 and $99,999 increased their on-person holdings to $87, slightly more than those with incomes greater than $125,000 (Figure 9). The cash holdings increased by the smallest increment for individuals in households with incomes between $100,000 and $124,999.16 This year, the individuals from lower income households, households that most likely had the least amount of savings or cash available elsewhere or for emergency use, reported holding significantly more on-person cash than prior years. It is probable that individuals in this income bracket increased their daily cash holdings as a safety net for emergency use during the pandemic.17
Figure 9
Average Daily On-Person Holdings by Household Income and Year
Section 4. How has shopping changed during the pandemic?
Number of Not-in-Person Payments Increased Slightly while Payment Values Increased Significantly
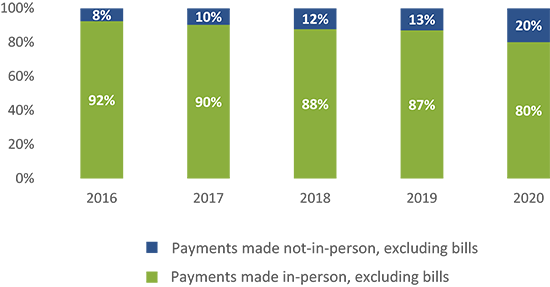
When entering transaction details, participants report the amount, merchant type, and payment instrument that was used. They also report whether the payment took place at the merchant location (in person) or not (not-in-person) and if a device such as a landline, mobile phone, tablet, or computer were used in making the payment. For example, a debit card payment at grocery store’s online store using a mobile phone would be considered a not-in-person payment while a debit card payment at the store using a payment app at the card reader while checking out would be an in-person payment. In both instances a mobile device was used to purchase groceries, but it is the specific location that differentiates these payments. While the pandemic changed how many people worked, traveled, and interacted with others, it also changed how and where many purchases for goods and services were made. Between 2016 and 2019 the share of not-in-person, non-bill payments made increased one to two percentage points each year, from 8 percent in 2016 to 13 percent in 2019.18 However, in 2020, the share of non-bill payments made online increased by more than 50 percent and comprised approximately 20 percent of non-bill payments.
Figure 10
Percent of Non-Bill Payments Made In-Person versus Not-In-Person
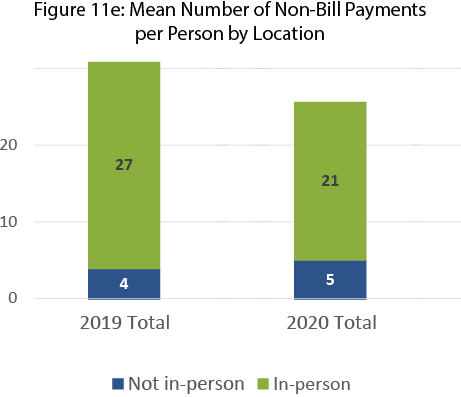
Two factors could be related to the increase in the share of not-in-person, non-bill payments (all payments in this section are referring to non-bill payments) between October 2019 and October 2020. The first factor was the average number of not-in-person payments consumers made each month increased from about four to five payments as people continued to practice social distancing, at least when compared to October 2019. The second factor was consumers made fewer in-person payments with participants reporting 26 non-bill payments in 2020, down from 31 payments in 2019.19 These two factors resulted in not-in-person, non-bill payments accounting for a larger share of non-bill payments.20
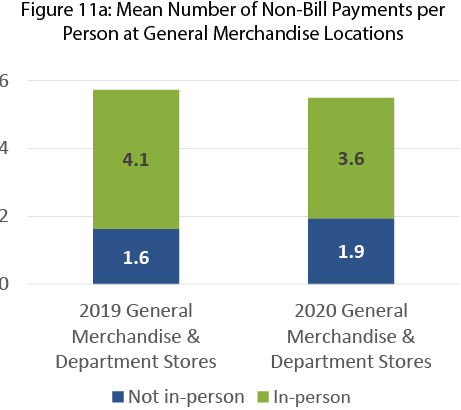
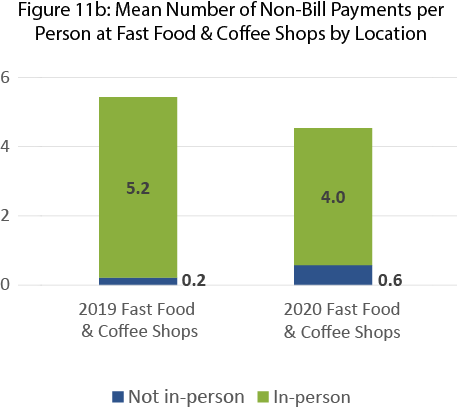
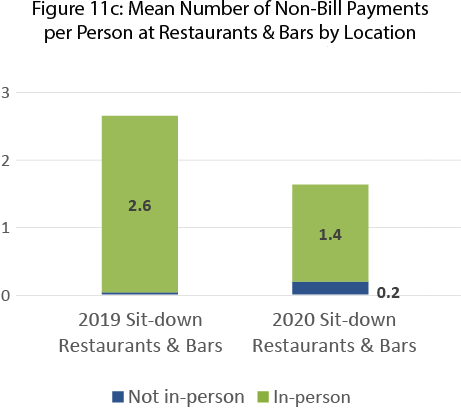
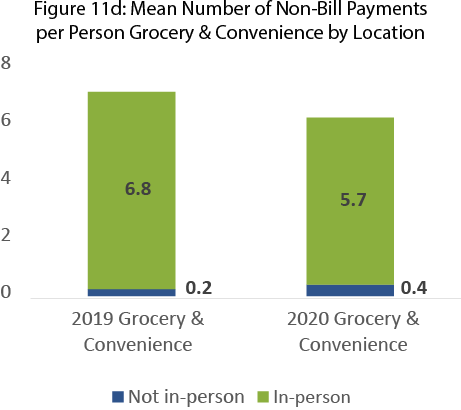
The aggregate increase of consumers using mobile apps or online marketplaces to make not-in-person, non-bill payment throughout the month took place essentially across four merchant types: grocery and convenience stores, sit-down restaurants and bars, fast food locations and coffee shops, and general merchandise (Figures 11 a-e). These merchant types show the same general pattern: the average number of payments for each merchant type decreased and the average number of not-in-person payments increased. This indicates an increased level of substitution away from in-person toward not-in-person payments.
Figures 11a-e
Mean Number of Non-Bill Payments per Person by Merchant Type
The increase of not-in-person payments, specifically for these merchants, is in line with results from the first supplemental survey in April where people reported increasing online or over the phone payments made at restaurants, grocery stores, and general merchandise stores, even at the start of the pandemic.21 The change in the number of not-in-person payments for each merchant type is not large. For example, one out of five consumers (an increase of 0.2 monthly payments) made an additional not-in-person payment at a grocery or convenience store and two out of five people (an increase of 0.4 payments) made an additional not-in-person payment at a fast food or coffee shop. On average, the results show that each Diary participant made one additional not-in-person payment in 2020 that would have likely been an in-person payment in 2019 (Figure 11e).
While the average number of not-in-person, non-bill payments made each month increased slightly, the total amount of money spent increased substantially across general merchandise, sit-down restaurants and bars, and grocery and convenience stores (Figure 12). The average amount spent for not-in-person, non-bill payments throughout October increased from $265 in 2019 to $326 in 2020.22 The increase in average payment values at general merchandise and department stores, sit-down restaurants and bars, and grocery and convenience stores changed considerably with increases ranging between $14 to $19.23 The increases in the average number payments and the average payment values made at these merchant types not only show that consumers increased not-in-person spending, but were also willing expand the types of goods and services purchased online when conducting not-in-person payments. For example, paying online for dine-in service at a restaurant before the pandemic was practically non-existent, as seen in the 2019 Diary data (Figure 11c). While uncommon, consumers did make not-in-person payments at fast food locations and coffee shops in 2019. But as demand for take-out from traditional dine-in restaurants increased, both the need and supply of not-in-person payment options increased, making it more likely consumers would use these payments at a wider range of restaurants and for a wider range of payment values. These changes do not suggest that these changes will be permanent after the pandemic. Instead, it proposes that the trends and changes in the payments system will be an area of continual research.
Figure 12
Mean Value per Payment for Not-In-Person, Non-Bills for Select Merchant Types
As expected, the 2021 Diary findings were quite different from prior years. The COVID-19 pandemic resulted in consumers reducing their total payments, mostly driven by a reduction in the number of in-person payments, which account for approximately 80 percent of all payments. While consumers continued to use cash for nearly 20 percent of all payments, the increase in consumers’ online shopping reduced opportunities to use cash. Despite a decline in cash use, consumers of all age and income groups were storing more cash elsewhere or holding more cash in their pocket, purse, or wallet, presumably as an instrument for emergency use.
In the future it will be interesting to see whether the changes in payment trends discussed in this paper are temporary or whether the pandemic acted as catalyst, accelerating trends already in motion. Consumers have historically held more currency during uncertain times and this pandemic is no different.24 As economic conditions evolve to a post-pandemic state, consumers may decide to hold elevated levels of cash as they continue to shift more and more payments to online platforms. Or perhaps the return to in-person shopping may bring a sense of normalcy and with it an increase in cash use for small-value payments, such as morning coffee, a quick run to the grocery store, or a drink with friends after work. Regardless of how the payments landscape evolves, it is important to note that consumers continue to use cash, though at a lower rate, even amid a pandemic.
Appendix
Diary of Consumer Payment Choice
The Federal Reserve’s national Cash Product Office (CPO) uses data from the Diary of Consumer Payment Choice (Diary) to understand consumer cash use and anticipate its ongoing role in the payments landscape. Developed by the Federal Reserve Bank of Boston’s Consumer Payment Research Center (CPRC) and currently managed by the Research Department at the Federal Reserve Bank of Atlanta, the Diary collects data about shopping and payments behavior from a unique, nationally representative survey of consumers administered by the University of Southern California (USC) Dornsife Center for Economic and Social Research. USC’s Understanding America Study panel of households comprises approximately 9,000 respondents from across the United States, 1,537 of which completed the 2020 Diary of Consumer Payment Choice.
By tracking consumer payment transactions and preferences during the month of October every year, the CPO compares cash with other payment instruments, such as debit and credit cards, checks, and electronic options. Diary participants also report the amount of cash on-hand after each survey day, cash stored elsewhere, and cash deposits or withdrawals conducted during their three-day reporting period. The CPO analyzes the Diary data, including the impact of age and income on an individual’s payment behavior and preferences. This detail of the stock and flow of cash at an individual level provides insight into how consumers use cash.
To ensure a nationally representative sample, responses are weighted to match national population estimates based on the Census Bureau’s Current Population Survey. The Diary is administered throughout the month of October, which was selected as a “typical month” to minimize seasonality effects in consumer spending patterns. Participants were each assigned a three-day period within the month, with some individuals assigned a starting date in late September and others assigned to finish in early November. For a more detailed description of the Diary of Consumer Payment Choice, see Angrisani, Foster, and Hitczenko (2017b); Angrisani, Foster, and Hitczenko (2018); Greene, Schuh, and Stavins (2018); Greene and Schuh (2017); Greene, O’Brien, and Schuh (2017); and Schuh (2017).
About the Cash Product Office
As the nation’s central bank, the Federal Reserve ensures that cash is available when and where it is needed, including in times of crisis and business disruption, by providing FedCash® Services to depository institutions and, through them, to the general public. In fulfilling this role, the Fed’s primary responsibility is to maintain public confidence in the integrity and availability of U.S. currency.
The Federal Reserve System’s Cash Product Office (CPO) provides strategic leadership for this key function by formulating and implementing service level policies, operational guidance, and technology strategies for U.S. currency and coin services provided by Federal Reserve Banks nationally and internationally. In addition to guiding policies and procedures, the CPO establishes budget guidance for FedCash® Services, provides support for Federal Reserve currency and coin inventory management, and supports business continuity planning at the supply chain level. It also conducts market research and works with financial institutions and retailers to analyze trends in cash usage.
Angrisani, Marco, Kevin Foster, and Marcin Hitczenko. 2018. “The 2015 and 2016 Diaries of Consumer Payment Choice: Technical Appendix.” Federal Reserve Bank of Boston Research Data Reports No. 18-2.
1. The Diary of Consumer Payment Choice has been conducted annually since 2016. Prior to 2016, two Diary studies took place with the first in using RAND’s American Life panel in October 2012 and the second conducted between mid-October and mid-December 2015 using Understanding America Study panel. Given the different panels from which participants are asked to participate and the different timeframe of these early Diary studies, this paper uses data starting with the 2016 Diary.
2. Additional information regarding the Understanding America Study panel, COVID-19 surveys and data can be found at the University of Southern California Dornsife Center for Economic and Social Research website Understanding America Study (usc.edu)
4. The 2019 and 2020 Diary were conducted over 3-day periods while the supplemental surveys in April and August 2020 asked participants to recall in-person payments ranging between 30 and 60 days. While this is not a direct comparison, the April and August survey showed that people conducted less in-person payments despite having a longer data collection period than the Diary.
6. This difference is statistically significant for a two tailed test at the 90 percent level.
7. In addition to the annual Diary study, the Federal Reserve conducted two supplemental surveys in April and August of 2020 which were designed to assess the impact of the pandemic on shopping behavior, cash holdings, cash avoidance, and consumers’ experiences with coin. The April supplemental survey asked individuals if they had made any in-person payments since March 10th, which was just before the declaration of a national emergency. The August supplemental survey asked participants whether they had made any in-person payments over the last 30 days.
8. The data collection for the 2020 Diary was conducted prior to the peak in COVID-19 cases across the United States which took place during Thanksgiving in November.
10. The share of payments indicates shares by number not by share of dollar value of payments. “Other” payments include bank account number payments, online banking bill pay, prepaid card, money orders, traveler’s checks, account-to-account transfers, and direct deduction from income.
11. In the April survey, 7 percent of the in-person payees reported that merchants refused cash.
13. The results reported in this section exclude the top 1 percent of on-person cash holdings. The decision to truncate the data this year rather than in previous years was to reduce the effect of outliers in 2020, which were more prominent than in previous Diary studies. As a result, comparisons to the same data reported in previous paper will differ slightly. The differences in holdings for those between 45 and 64 were statistically significant at the 95 percent level and those under 25 were statistically significant at the 90 percent level.
14. The 2020 Supplemental Survey concluded that the data cannot conclusively determine how strongly the changes in cash holdings were driven by Economic Impact Payments (EIPs) or uncertainty around the pandemic. If EIPs were a key driver in respondents increasing cash holdings, the continued uncertainty regarding the pandemic may explain why respondents continue to hold an increased amount of store of value cash. Please refer to the “Consumer Payments and the COVID-19 Pandemic: The Second Supplement to the 2020 Findings from the Diary of Consumer Payment Choice” for more details.
16. The differences in on-person cash holdings were statistically significant at the 95 percent confidence internal for all income groups except those in households earnings $50,000 to $74,999 and $100,000 to $125,000.
17. This section of the Diary is interested in changes in the amount of cash that is being held for payments. Therefore, the discussion of cash held is focused on cash held throughout the day rather than cash stored elsewhere.
18. Not-in-person payments refers to payments not made at the merchant location and generally a device is used to complete the payment. Examples of a device that could be used are one’s mobile phone, tablet, computer, watch landline, or mail.
19. The number of total payments also decreased in 2020 compared to 2019. However, as bill payments in previous Diary studies show a higher share of not-in-person payments when compared to non-bill payments, the focus here is to show that traditionally non-bill payments shifted from in-person to not-in-person during the pandemic, even in sectors of the economy where the share of in-person payments remained high.
20. If not-in-person, non-bill payments were unchanged between 2019 and 2020, they would have accounted for 4 out of 26 non-bill payments, or 15 percent, rather than 4 out of 31, or 13 percent as was the case in 2019.
22. This average per-person difference was not statistically significant, though the average transaction values for the merchant types shown in Figure 14 are statistically significant at the alpha = 0.10 level.
23. Observations with a payment value in the top one percent for each merchant type were not included to reduce the effect large payment values may have on average values.
24. The value of currency in circulation (CIC) increased by more than $75 billion between March 4th 2020 and April 8th 2020 following the declaration of a national emergency. For comparison, the CIC increased by approximately $80 billion throughout all of 2019. The CIC data can be found at Currency in Circulation: Week Average St. Louis Fed