


The American Rescue Plan provided fiscal support during a strong economic rebound, raising concerns about the risk of fueling inflation. One way to assess this risk of economic overheating uses the ratio of job vacancies to unemployment, which measures labor market slack more accurately and, hence, can predict future inflation better than the unemployment rate alone. Estimates suggest that the fiscal plan acts to temporarily raise the vacancy-to- unemployment ratio, in turn pushing up inflation by about 0.3 percentage point per year through 2022.
In an effort to stabilize the U.S. economy through the severe disruptions caused by the COVID-19 pandemic, Congress passed a series of packages amounting to the largest macroeconomic fiscal relief since the New Deal of the 1930s. Beginning with the $2.2 trillion CARES Act in March 2020 and followed by $900 billion of additional relief in December, the relief effort continued into 2021 with the passing of the $1.9 trillion American Rescue Plan (ARP) this past March.
By the time the ARP was passed, the economy had at least partially recovered from the pandemic. The later timing and large size of the ARP stirred debate about whether it is causing an overheating of the economy and fueling a sustained increase in inflation. For example, former Treasury Secretary Larry Summers stated, “there is a chance that macroeconomic stimulus on a scale closer to World War II levels than normal recession levels will set off inflationary pressures of a kind we have not seen in a generation” (Summers 2021). Whether or not the economy is overheating depends directly on the level of economic activity relative to its available supply or capacity. This gap between current aggregate demand and capacity, sometimes referred to as “slack,” is difficult to precisely measure because it is not observable and must be inferred from statistical or economic models. The challenge is exacerbated in volatile economic times such as the pandemic and is one of the main reasons for the great deal of uncertainty around overheating risks.
In this Economic Letter, we assess the risk of sustained inflationary overheating using the ratio of job vacancies to unemployment. This measure of slack accounts for both the demand for and supply of labor and thus has been shown to predict future inflation more accurately than the unemployment rate alone. Our estimates show that the ARP could raise the vacancy-to-unemployment ratio close to its historical peak in 1968. However, this large increase translates into only a temporary increase in core personal consumption expenditures (PCE) inflation of about 0.3 percentage point per year through 2022. This minor impact is attributable to the small effect of slack on inflation and the strong historical stability of longer-run inflation expectations.
The vacancy-to-unemployment ratio
One of the most commonly used indicators of the state of the overall economy and the business cycle is the unemployment rate, defined as the number of individuals actively looking for work relative to the size of the labor force. Figure 1 depicts its evolution since 1990 (solid green line). After spiking at close to 15% in April 2020, the unemployment rate dropped to 4.8% as of September 2021.
Figure 1
Unemployment, job vacancies relative to 30-year averages
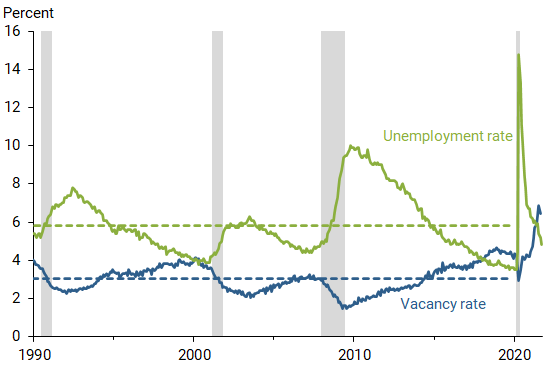
Source: Bureau of Labor Statistics.
Note: Dashed lines show 30-year averages.
While the unemployment rate tracks the supply of workers available in the market, it does not provide information about employers’ demand for labor to fill open positions. Tracking the number of job openings can give a sense of the strength of labor demand over time. Figure 1 shows the vacancy rate (solid blue line), defined as the number of job openings relative to the size of the labor force.
Currently, the unemployment and vacancy rates are sending conflicting signals. The unemployment rate now sits just below its pre-pandemic 30-year average (dashed green line), suggesting that the labor market is not yet overly tight. However, the vacancy rate is well above its 30-year average (dashed blue line) and has surpassed its historic highs from the late 1960s (not shown), indicating that employers are having a difficult time filling positions. Confirming this high vacancy rate, the fraction of small businesses reporting that job openings are hard to fill is at historic highs (Dunkelberg 2021).
Instead of considering each series separately, we can get a better assessment of labor market slack by considering the ratio of the two—the vacancy-to-unemployment ratio—which is a central concept in the academic literature on unemployment (see, for example, Pissarides 2000, Barnichon and Figura 2015). This ratio captures the level of labor demand relative to the level of labor supply. As such, it should better capture slack than the unemployment or vacancy rate alone: an increase in the vacancy-to-unemployment ratio can be interpreted as a higher demand for labor relative to supply, that is, less labor market slack.
Figure 2 shows a historical view of the vacancy-to-unemployment ratio. It peaked during the hot labor market of the 1960s, when there were over 1.5 job vacancies per unemployed person, and bottomed out during the Global Financial Crisis, when there were only 0.15 vacancies per unemployed person. The August 2021 ratio shows about 1.25 vacancies per unemployed person, which is higher than its historical average of 0.6, but still below its record high.
Figure 2
Vacancy-to-unemployment ratio relative to 60-year average
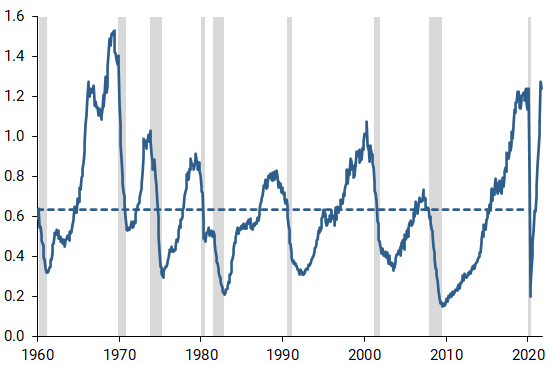
Source: Bureau of Labor Statistics and Barnichon (2010).
Note: Dashed lines show 60-year averages.
How inflation relates to the vacancy-to-unemployment ratio
The Phillips curve describes the traditional relation of inflation to labor market slack. That is, inflation tends to pick up when there is less labor market slack, because tight labor markets force businesses to raise wages, and subsequently prices, to attract and retain employees. Because the vacancy-to-unemployment ratio captures the relative supply and demand for labor, it should capture companies’ hiring costs more accurately and thus should be able to track inflationary pressures better than either the unemployment or vacancy rate alone. Surprisingly though, despite its central role in the academic literature, the vacancy-to-unemployment ratio is rarely considered when measuring inflationary pressures.
To study the ability of the vacancy-to-unemployment ratio to explain inflation, we estimate a standard Phillips curve model using this ratio as a measure of slack, controlling for business expectations of future inflation. Figure 3 shows the relationship between slack and core PCE inflation, which eliminates volatile food and energy prices. We estimate this over 1960–2021, displaying the impact of an increase in the vacancy-to-unemployment ratio on next-quarter inflation (blue bar). For comparison, we show the results of a similar regression that measures slack using the unemployment rate (green bar). In each regression, we rescaled the labor market slack measure by its standard deviation so that the estimated coefficients (blue versus green) are directly comparable, each corresponding to the effect of a one unit increase in slack. The black lines indicate the accuracy of each estimate within a 95% range of confidence. With this rescaling, the larger estimated coefficient and its position within the confidence range implies that the vacancy-to-unemployment ratio has a stronger and more precise relationship with inflation than the unemployment rate.
Figure 3
Phillips curve estimates using two measures of slack
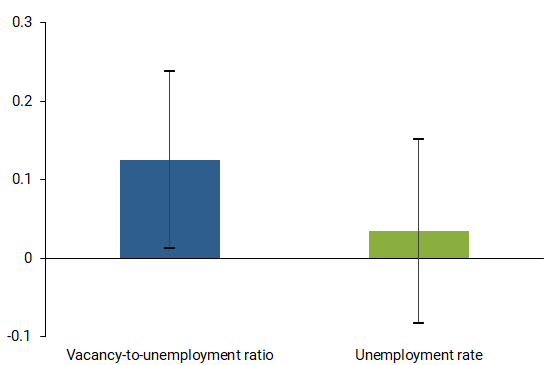
Note: Bars show impact of one-standard-deviation increase in slack measure on core PCE inflation; black lines show 95% confidence intervals for coefficients.
Impact of the ARP on vacancy-to-unemployment ratio and inflation
As a final exercise, we assess the impact of the recent fiscal package, the ARP, on inflationary overheating risk by estimating its effect on the vacancy-to-unemployment ratio. Our estimate builds on a recent study by Ramey and Zubairy (2018). Drawing on more than 100 years of U.S. data, Ramey and Zubairy identify historical changes in fiscal spending related to wars or geopolitical events. Since these changes are unrelated to the business cycle, they can be used as natural experiments to infer the causal effects of changes in public spending on economic activity.
The blue line in Figure 4 shows the response of labor market tightness to a fiscal package the size of the ARP spent over the course of 2021. We assume that the effects of the relief package begin in March 2021, and we show the impact as of the end of each year. The results show that the ARP is expected to push the vacancy-to-unemployment ratio up further by approximately 0.6 units over 2021, and less than 0.5 units by the end of 2022. This effect is large, given that labor market tightness currently stands at about 1.25 units.
Figure 4
Estimated impact of ARP on vacancy-to-unemployment ratio
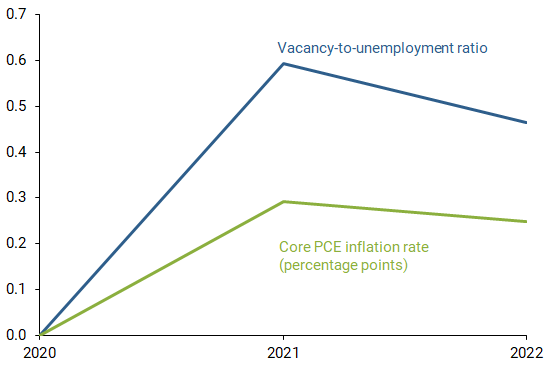
Note: Impact on vacancy-to-unemployment ratio is measured in job vacancies per unemployed person; impact on core PCE inflation is measured in percentage points.
Figure 4 also shows the impact of the ARP on core PCE inflation using the Phillips curve relationship between the vacancy-to-unemployment ratio and core PCE inflation. The results show that the increase in labor market tightness, attributable to the ARP, is expected to cause inflation to increase by about 0.3 percentage point in 2021 and by a bit more than 0.2 percentage point in 2022. The impact in 2023 is negligible and is not shown in the figure. Thus, the estimated impact of the ARP on inflation is meaningful, but it is still a far cry from the strong overheating of the 1960s.
The evolution of the impact on inflation from the ARP is dependent on two factors. First, as shown in Figure 4, the ARP’s impact on labor market tightness is temporary, as it peaks in 2021 but falls thereafter. This transitory impact on tightness is then passed on to its impact on inflation, as described by the Phillips curve relationship. Second, although there is some risk that the recent high inflation episode could make businesses expect higher future inflation and thereby cause longer-run inflation expectations to rise, we assume that expectations for longer-run inflation remain strongly anchored as they have been over the past 20 years.
Conclusion
The degree of overheating risk posed by the American Rescue Plan of 2021 depends critically on the level of economic slack. The closer the economy is to its capacity, the more likely the fiscal package will lead to economic activity surpassing capacity and thus fuel inflationary pressures. While measures of slack such as the unemployment rate suggest the economy is far from a full recovery, measures of labor demand such as the vacancy rate show the economy may already be in a heated state. We use a measure of slack that takes into account both of these metrics, the vacancy-to-unemployment ratio.
Our analysis suggests that the ARP is projected to cause a transitory increase in the vacancy-to-unemployment ratio, which translates into a core inflation rate that is about 0.3 percentage point higher per year through 2022. The impact of the ARP on inflation rests on the transitory nature of the fiscal spending increase, but also on the stability of longer-run inflation expectations.
Regis Barnichon is a senior research advisor in the Economic Research Department of the Federal Reserve Bank of San Francisco.
Luiz E. Oliveira is a senior associate economist in the Economic Research Department of the Federal Reserve Bank of San Francisco.
Adam H. Shapiro is a vice president in the Economic Research Department of the Federal Reserve Bank of San Francisco.
References
Barnichon, Regis. 2010. “Building a Composite Help-Wanted Index.” Economics Letters 109(3), pp. 175–178.
Barnichon, Regis, and Andrew Figura. 2015. “Labor Market Heterogeneity and the Aggregate Matching Function.” American Economic Journal: Macroeconomics 7(4), pp. 222–249.
Dunkelberg, William C. 2001. NFIB Small Business Jobs Report. July.
Pissarides, Christopher. 2000. Equilibrium Unemployment Theory, 2nd edition. Cambridge, MA: MIT Press.
Ramey, Valerie A., and Sarah Zubairy. 2018. “Government Spending Multipliers in Good Times and in Bad: Evidence from U.S. Historical Data.” Journal of Political Economy 126(2), pp. 850–901.
Summers, Lawrence H. 2021. “Opinion: The Biden Stimulus Is Admirably Ambitious. But It Brings Some Big Risks, Too.” Washington Post, February 4.
Opinions expressed in FRBSF Economic Letter do not necessarily reflect the views of the management of the Federal Reserve Bank of San Francisco or of the Board of Governors of the Federal Reserve System. This publication is edited by Anita Todd and Karen Barnes. Permission to reprint portions of articles or whole articles must be obtained in writing. Please send editorial comments and requests for reprint permission to research.library@sf.frb.org