
Labor force participation in the United States has dropped a percentage point since the pandemic began. Analyzing how participation has evolved for various groups of the population suggests that more than two-thirds of this decline has been due to persistent “trend” factors. The remainder is due to temporary economic conditions, or “cyclical” factors. Estimates project that trend factors—driven largely by population aging—could push labor participation down an additional percentage point over the next decade.
Three years since the pandemic hit, unemployment has not only fully recovered but has dropped to near-historical lows. However, the labor force participation (LFP) rate remains persistently low at 62.6% as of July 2023, almost a percentage point below its pre-pandemic level in February 2020. This raises the question of whether the pandemic permanently reduced participation or whether LFP still has the potential to move upwards.
In this Economic Letter, we assess whether LFP is unusually high or low and where it might be headed by comparing it with its trend. We define trend LFP as the rate expected to prevail once business cycle factors dissipate. Because the trend is not observed directly, we estimate the trend using a method described in Hornstein and Kudlyak (2019). The method consists of estimating the trends in LFP rates for different sociodemographic groups and then aggregating those group-specific trends. This allows us to distinguish between contributions to LFP trends from each of these groups and contributions from changes in the composition of the population across the groups.
Our analysis suggests that over two-thirds of the 1 percentage point drop in overall LFP from 2019 to 2022 can be attributed to a decline in trend LFP, with cyclical factors explaining the rest. Most of the drop in trend LFP is due to changes in the composition of the population, especially aging of the population. Looking ahead, we estimate that aggregate trend LFP will decline approximately 1 additional percentage point over the next decade, driven primarily by population aging.
Cycles and trends in the labor force participation rate
The overall LFP rate is an aggregate of the LFP rates of different demographic groups in the U.S. population. It can change over time either due to changes in the population composition—such as a larger share of older individuals, who typically participate at lower rates—or because the LFP rates change for one or more of the groups. Some of the movement in group rates reflect long-run developments. For example, participation rates for women have increased greatly over the past several decades. Other movements reflect temporary fluctuations related to the business cycle.
Using Current Population Survey (CPS) microdata from 1976 to 2022, we construct annual LFP rate series for groups defined by the intersection of seven age categories—16–19, 20–24, 25–34, 35–44, 45–54, 55–64, and 65 and older—two genders, and four educational categories for those older than 24; this creates 44 distinct groups in total.
Next, we divide each gender-education-age group’s LFP rate into its cyclical and trend components. The cyclical component captures how a group’s LFP rate tends to move together with the business cycle, which we estimate by calculating how the group’s LFP rate moves with the overall unemployment rate. We model the trend component as reflecting changes due to separate birth-year cohort effects and age effects. The cohort effect captures the part of LFP associated with all individuals born in a particular year, which remains fixed as the cohort ages. For example, cohort-specific trends account for the possibility that different generations, such as the baby boom or Generation X, have different norms about working. Age effects capture how a person’s labor force participation changes over their life cycle. For example, people tend to retire as they approach age 65. In our estimation, we allow age effects to vary over time. A time-varying age-specific effect captures developments such as people retiring earlier during the pandemic.
We rely on these estimated relationships to calculate the cohort, age, and cyclical effects using annual data on each group’s unemployment and LFP rates. We also construct projections of how these group-specific trends will evolve over the next 10 years. Given the statistical properties of our model, our best estimate of the future paths of the cohort and age effects are simply their latest observed values.
Finally, we construct the aggregate trend using a population-weighted average of the group-specific trend projections. To determine these population weights, we combine the age and gender composition projections from the Congressional Budget Office and the educational shares projections from our own statistical model.
Figure 1 displays our estimated aggregate trend LFP (solid blue line) and projections of future trend LFP (dashed blue line), along with the actual LFP rate from CPS data (green line). We find that, despite its sharp drop during the pandemic, the actual LFP rate recovered and was above our estimated trend by 2022. The LFP rate rising above the estimated trend is indicative of cyclical effects from a relatively tight labor market in 2022. Overall, we find that 0.7 of the 1.0 percentage point drop in the actual LFP rate between 2019 and 2022 can be attributed to a decline in trend LFP.
Figure 1
Estimated trend in aggregate labor force participation
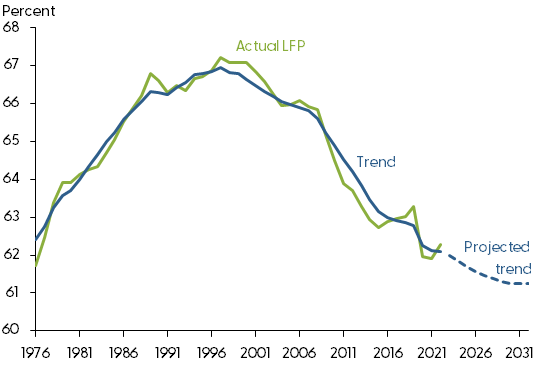
Source: Current Population Survey (1976-2022 microdata) and authors’ calculations.
What drove changes in the aggregate LFP trend?
To help understand why trend LFP has continued to decline since 2019, Figure 2 shows a decomposition of this 0.7pp decline into changes in the population composition versus changes in group-specific LFP trends. Compositional changes explain two-thirds of the decline (0.45pp) while group-specific trends explain the remaining third of the decline (0.24pp). Drilling deeper, we find the compositional effect comes from a large negative effect that population aging has on LFP, which is only partially offset by a positive effect from increased educational attainment. This shows that continued population aging moved an increasing share of the population into low labor force participation age groups; for more details, see Figure 1 in Hornstein, Kudlyak, and Schweinert (2018).
Figure 2
Contributions to aggregate LFP trend changes, 2019–2022
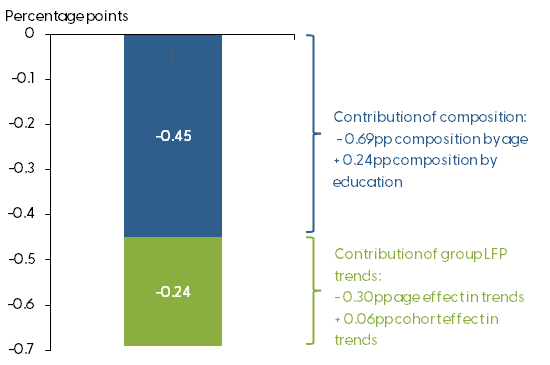
Source: Authors’ calculations using CPS microdata.
We also drill down to separate the decline in group-specific LFP trends into birth-cohort and time-varying age effects. We find that the decline is primarily due to age effects, such as lower participation at a given age than was typical before the pandemic. Further analysis shows that most of the age effect reflects the higher than usual propensity of people over age 55 to retire.
We also see differences in how trend LFP rates have evolved across groups since 2019. For instance, while trend LFP for women overall has declined since 2019, the entire decline comes from the 55 and older age group, with almost no change in trend for women of prime working age, 25–54. This apparent lack of change masks two opposing trends among prime-working-age women: for women with a college degree or more, the LFP trend has gone up, while for women without a college degree, the LFP trend has gone down. For men, on the other hand, a decline in trend LFP stems from declining trends for both the 25–54 and 55 and older groups. This decline for men holds true across all education levels.
Our results are consistent with the view that retirement has been an important driver of LFP declines since the pandemic, the so-called COVID retirement boom. Nearly all of the decline in group-specific LFP trends—which we showed above accounts for about one-third of the total decline in trend LFP since 2019—can be attributed to declines in trend LFP for people ages 55 and older. In other words, Americans retired at younger ages during the pandemic than they have historically, and this contributed to the decline in overall LFP.
Our results also echo earlier findings that women without a college degree disproportionately dropped out of the labor force during the pandemic, perhaps to care for children or sick relatives. However, we find that women with a college degree or more increasingly joined the labor force during this period, potentially because of more opportunities to work from home. Our estimation method attributes the developments in early retirement and women with lower educational attainment dropping out of the labor force during the pandemic to changes in group-specific trends—that is, trend rather than cyclical factors. As such, we expect these trends to continue over the near term. However, over the next few years or longer, these factors could cease or even reverse, as suggested in Montes, Smith, and Dajon (2022).
Labor force participation going forward
Based on our statistical model, we project that the trend in the aggregate LFP rate will decline an additional 1 percentage point between 2022 and 2032 (see blue dashed line in Figure 1). The projected decline comes entirely from changes in the population composition because our methodology assumes that group-specific LFP trends will remain constant going forward. Population aging looms large in this projection: we project the aggregate trend will decline as more of the population enters age groups with low participation rates. This is expected to more than offset the positive effect on LFP from the projected growth for people with higher educational attainment, as LFP tends to increase with education.
Conclusion
This Letter studies post-pandemic labor force participation and where it may be headed in the coming years. We construct a trend for the aggregate LFP rate based on our estimates of trend rates for gender-education-age groups. We then use this to gauge how far the current actual participation rate is from its trend and, therefore, whether participation is currently high or low. We find that LFP was above trend as of 2022, reflecting the cyclical influences of the tight labor market. However, going forward, our estimates project that trend forces, primarily reflecting demographic changes such as population aging, will continue to exert downward pressure on the LFP rate.
Andreas Hornstein
Senior Advisor, Economic Research Department, Federal Reserve Bank of Richmond
Marianna Kudlyak
Research Advisor, Economic Research Department, Federal Reserve Bank of San Francisco
Brigid Meisenbacher
Research Associate, Economic Research Department, Federal Reserve Bank of San Francisco
David A. Ramachandran
Research Associate, Economic Research Department, Federal Reserve Bank of Richmond
References
Hornstein, Andreas, and Marianna Kudlyak. 2019. “Aggregate Labor Force Participation and Unemployment and Demographic Trends.” FRB San Francisco Working Paper 2019-07.
Hornstein, Andreas, Marianna Kudlyak, and Annemarie Schweinert. 2018. “The Labor Force Participation Rate Trend and Its Projection.” FRBSF Economic Letter 2018-25 (November 19).
Montes, Joshua, Christopher Smith, and Juliana Dajon. 2022. “The Great Retirement Boom: The Pandemic-Era Surge in Retirements and Implications for Future Labor Force Participation.” Finance and Economics Discussion Series, Federal Reserve Board Discussion Paper 2022-081.
Opinions expressed in FRBSF Economic Letter do not necessarily reflect the views of the management of the Federal Reserve Bank of San Francisco or of the Board of Governors of the Federal Reserve System. This publication is edited by Anita Todd and Karen Barnes. Permission to reprint portions of articles or whole articles must be obtained in writing. Please send editorial comments and requests for reprint permission to research.library@sf.frb.org