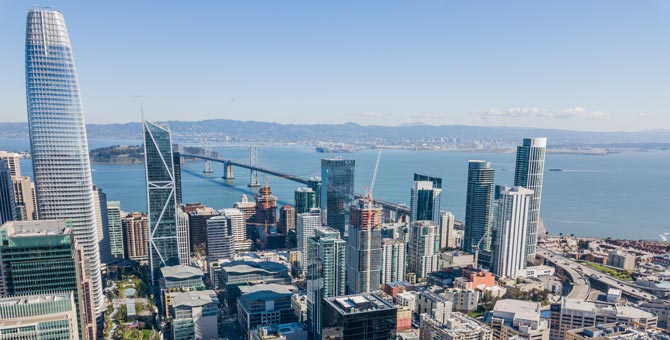
Despite significant economic uncertainty, commercial real estate in the Twelfth District recovered, albeit unevenly. The pandemic is creating clear winners and runners-up for CRE—and our First Glance 12L look at 4Q data underscored those realities. In 2021, the industrial and apartment sectors were red hot, while retail and office metrics were more lukewarm. And some metro areas performed better than others.
Here’s a deeper dive into the factors driving these conditions in the District during the last quarter in 2021:
Industrial and Apartment are CRE Standouts
The pandemic accelerated the number of online purchases made by consumers as buying activity shifted from in-person to a computer screen, and at the same time curtailed spending on in-person services. As such, demand for industrial properties increased due to the need for more warehouse space to accommodate those shipments, resulting in low vacancy rates, low capitalization rates, and elevated property transaction volumes. The strength of industrial markets was evident in Real Capital Analytics’ national property price index for the sector, which increased by 55% over the three years ending 2021 (see Figure 1).
2021 broke records for industrial CRE and delivered some eye-popping numbers. Industrial transactions in the west region were 28% higher in 2021 compared to the next highest year on record (since 2001). And in the Twelfth District, six industrial property markets registered among the 10 lowest vacancy rates across all markets in the nation covered by CBRE-EA in 4Q21. These included the four major markets near the Ports of Los Angeles and Long Beach, which handle large import volumes. Conversely, San Francisco Bay Area markets continued to have notably higher industrial vacancy rates in 4Q21 than before the pandemic, although vacancy rates in these markets declined slightly over the course of 2021.
COVID-related behavior shifts also impacted apartment data. The sector saw a higher volume of transactions in Q4 than earlier in the pandemic. Initially, many people moved from denser, multi-family buildings into single-family homes, which sent single-family home prices soaring, aided by low-interest rates. Now, however, data show that apartment vacancy rates in the Twelfth District were the lowest on record in 4Q21. Across District markets, average real apartment rents grew rapidly in 2021, after declining sharply in 2020, and were roughly even with pre-pandemic levels as of 4Q21. The bounce back in the apartment market may be due to people feeling more optimistic about the pandemic winding down and longstanding housing supply challenges reasserting themselves. Nationally, the apartment property price index accelerated in 2021.
Despite these record numbers in the apartment sector, Bay Area markets were also outliers, with 4Q21 real rents more than 10% below 4Q19 levels in San Francisco and San Jose and off 5.9% in Oakland. Yet in much of the rest of the District—except Los Angeles and Seattle—apartment rents topped pre-pandemic levels, particularly Phoenix and Tucson, which were up 20% each.
Figure 1
Commercial Property Indices, Nation
Dec-18 = 100
| Office | Industrial | Retail | Apartment | ||
|---|---|---|---|---|---|
| CBD | All | All | All | All | |
| December 2018 | 100 | 100 | 100 | 100 | 100 |
| December 2019 | 104 | 105 | 109 | 102 | 110 |
| December 2020 | 103 | 107 | 120 | 100 | 118 |
| December 2021 | 107 | 123 | 155 | 121 | 146 |
Source: Real Capital Analytics
Ongoing Struggles and Signs of Improvement for Office Sector
Even though CRE price growth and transactions set new records in industrial and apartment, those sky-high numbers did not translate to the office sector.
Generally, office transactions recovered significantly in 2021 relative to subdued volumes in 2020. They are now running about where they were just before the pandemic in 2018 and 2019. However, this was still a decrease relative to the transaction levels seen in 2007 and 2015. This 2021 performance was mainly due to suburban office transactions. In contrast, downtown (CBD) office property trades in 2021 (full year) remained 40% below their 2019 levels.
Meanwhile, the District’s average real office rents fell by 8.8% over the two years ending 4Q21. Real rents declined in all District markets, most dramatically in San Francisco (down 17.7%) and Orange County (down 8.7%).
Nationally, CBD office prices finally regained their pre-pandemic level in September 2021, but a large majority of market participants still expected a significant decline in long-term office demand, according to RCLCO’s Year-End 2021 Survey, as businesses increasingly adopt a “new normal” of remote and hybrid work arrangements.
For more details on economic and banking conditions across the District, visit the full First Glance 12L 4Q21 report.
Elizabeth Lawson-Kurdy is the communications lead for Supervision + Credit on the Communications + Experience team the at the Federal Reserve Bank of San Francisco.
You may also like:
The views expressed here do not necessarily reflect the views of the management of the Federal Reserve Bank of San Francisco or of the Board of Governors of the Federal Reserve System.
