

Inflation has climbed since 2021, as the labor market has tightened. Two historical data relationships can account for elevated inflation over the past two years: the Beveridge curve, which relates job vacancies and unemployment rates over the business cycle, and a nonlinear version of the Phillips curve, which links inflation to labor market slack. Combining estimates of the two curves implies that inflation can fall in conjunction with a “soft landing” for the economy if labor market easing is achieved mainly by reducing job vacancies rather than increasing unemployment.
See February 21, 2024, update in SF Fed Blog
The Federal Open Market Committee (FOMC) is focused on reducing current elevated inflation while avoiding a substantial rise in the unemployment rate. The likelihood of achieving this so-called soft landing hinges on two key empirical relationships in U.S. data: the Beveridge curve and the Phillips curve. The Beveridge curve is the relationship between job vacancies and unemployment, both of which influence the amount of labor market slack. The Phillips curve is the relationship between labor market slack and inflation.
In this Economic Letter, we bring the Beveridge and Phillips curves together in a novel way that provides insight into the relationship between inflation and a particular measure of labor market slack, the ratio of the unemployment rate to the job vacancy rate. The Beveridge and Phillips curves often appear in economic models as linear relationships to simplify calculations. In contrast, we use nonlinear versions of both curves, which more accurately capture U.S. data, particularly in this period of elevated job vacancy and inflation rates but very low rates of unemployment.
As described in Bok et al. (2022), our fitted nonlinear Beveridge curve is very steep at low rates of unemployment. This result implies that vacancies can fall from current elevated levels without causing a substantial rise in unemployment. Similarly, our nonlinear Phillips curve fitted to U.S. data is very steep when the unemployment-to-vacancy ratio is very low, as it is now. This result implies that a relatively small increase in labor market slack can push inflation down from current elevated levels, provided that people’s inflation expectations remain well anchored. Taken together, the two fitted curves clarify a potential—albeit not guaranteed—path to a soft landing for the economy.
Inflation, unemployment, and vacancies
Figure 1 plots the data series that underlie the fitted Beveridge and Phillips curves in our analysis. The sample period runs from January 1999 to May 2023. We choose this sample period because it represents a time when measures of long-run inflation expectations from surveys remained well anchored near the Federal Reserve’s longer-run inflation goal of 2% (Jørgensen and Lansing 2023). This is important for our analysis because, according to economic theory, inflation depends not only on the amount of labor market slack, as measured by the balance between unemployed workers and available jobs, but also on the inflation rate that people expect to prevail in the future. In constructing our fitted Phillips curve, we assume that the relevant measure of expected inflation pertains to the long run, which can be approximated by a constant value of 2%.
Figure 1
Core PCE inflation and unemployment-to-vacancy ratio
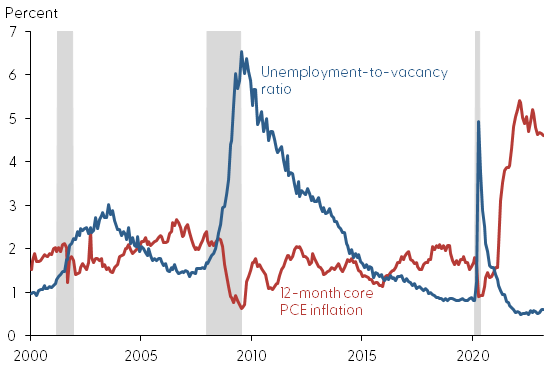
We measure inflation using the 12-month change in the core personal consumption expenditures (PCE) price index. By excluding volatile food and energy components, this core measure tends to provide a clearer forecast of future headline PCE inflation, which is the measure targeted by the FOMC. Core inflation rose from 1.6% in January 2021 to a peak of 5.4% in February 2022. Since then, inflation has declined somewhat to 4.6% in May 2023.
Research shows that accounting for both the unemployment rate and the job vacancy rate helps in forecasting future inflation (Barnichon and Shapiro 2022). Our measure of labor market slack is the ratio of the unemployment rate to the job vacancy rate. This measure of slack moves in the same direction as the unemployment rate over the business cycle but contains additional information about employers’ demand for workers, as reflected by the job vacancy rate. The unemployment-to-vacancy ratio rises during recessions and falls during expansions, much like the unemployment rate itself. Figure 1 shows that inflation tends to be high when the unemployment-to-vacancy ratio is low and vice versa. Notably, recent values of the unemployment-to-vacancy ratio are near record lows and below those observed during the historically strong labor market of 2018 and 2019. This pattern helps to account for today’s elevated inflation rates relative to those observed in 2018 and 2019, as we discuss further below.
Fitting a nonlinear Beveridge curve
The unemployment-to-vacancy ratio from Figure 1 displays a pronounced asymmetric response to the changing business cycle, rising rapidly during recessions but declining slowly during expansions. The Beveridge curve in Figure 2 represents the relationship between the unemployment rate on the horizontal axis and the job vacancy rate on the vertical axis. The red dots highlight the data since March 2020, covering the pandemic recession and its aftermath. As discussed by Bok et al. (2022), the onset of the pandemic recession triggered a large increase in job layoffs, causing the Beveridge curve to temporarily shift outward. But by late 2021, the red dots shifted back as the labor market recovered from the pandemic recession.
Figure 2
Fitted Beveridge curve
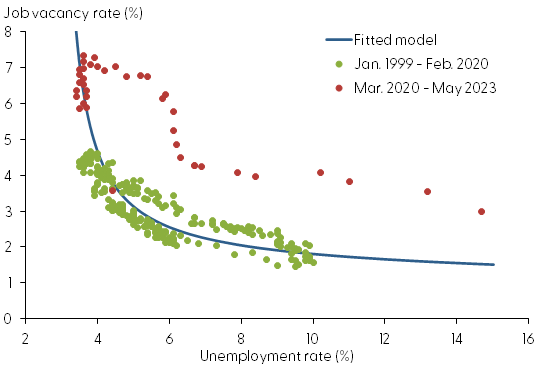
The blue line in Figure 2 shows the fitted Beveridge curve using data from January 1999 through February 2020, following the approach in Bok et al. (2022). Shortening the sample period allows the fitted curve to capture the behavior of a normal labor market that excludes the temporary pandemic disruptions.
The most recent vacancy and unemployment data lie on the steep upper-left portion of the pre-pandemic fitted Beveridge curve. Provided that the fitted curve remains stable, it supports the idea that the vacancy rate can decline from current elevated levels without a substantial rise in the unemployment rate. Indeed, the vacancy rate has already declined from a high of 7.4% in March 2022 to 5.9% in May 2023, with very little change in the unemployment rate.
Fitting a nonlinear Phillips curve
The original Phillips curve dates back to Phillips (1958), who documented a nonlinear link between nominal wage growth and unemployment in the United Kingdom from 1861 to 1957. As the unemployment rate declined, wage growth increased, with the curve becoming much steeper when unemployment dropped below 3%.
Recall that our measure of labor market slack is the ratio of the unemployment rate to the job vacancy rate. These two variables also appear in the Beveridge curve. Reminiscent of the original Phillips curve, we show that, as the unemployment-to vacancy ratio declines, inflation increases, with the curve becoming much steeper when the ratio drops below 1.0.
A decline in the unemployment-to-vacancy ratio implies that fewer people are seeking jobs relative to the number of existing job openings, making it more difficult for employers to find and hire qualified workers. Under this view, even as businesses raise prices in the face of strong demand for their products, increased job posting activity becomes less successful at recruiting the workers needed to raise output and meet the demand. This environment produces a steeper Phillips curve when the labor market is very tight, as indicated by an unemployment-to-vacancy ratio below 1.0. The same environment implies that the shape of the Phillips curve is linked directly to the shape of the Beveridge curve because both curves are governed by the underlying process by which jobs and workers are matched in the labor market.
Figure 3 plots inflation on the vertical axis against the unemployment-to-vacancy ratio on the horizontal axis. We assume that the characteristics of the underlying matching process between jobs and workers are the same for this fitted Phillips curve as those used to fit the Beveridge curve in Figure 2.
Figure 3
Fitted nonlinear Phillips curve
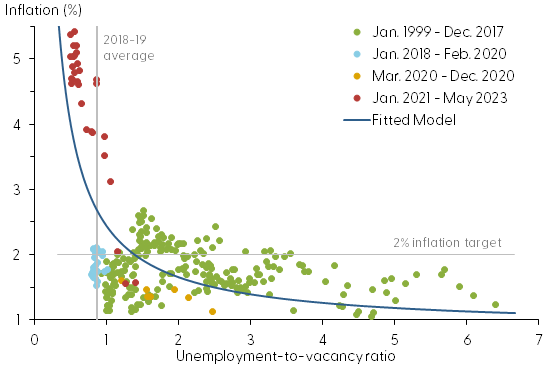
The red dots in Figure 3 show the most recent data from January 2021 onward, when inflation rose more than 3 percentage points before reaching a peak value of 5.4% in February 2022. These elevated inflation rates follow along the steepest part of the Phillips curve and correspond to the lowest unemployment-to-vacancy ratios. Notably, these low ratios are below those observed during the years 2018 and 2019, which was another period when the labor market was very tight. While those earlier unemployment-to-vacancy ratios hovered around 0.9, recent highs in job vacancies pushed the ratio down to a record low of 0.5 in March 2022, implying even less slack in the labor market.
Provided that the Phillips curve remains stable with well-anchored inflation expectations, the fitted curve supports the idea that a relatively small increase in labor market slack can bring inflation down from current elevated levels. The required increase in slack can be achieved by either an increase in unemployment or a decrease in vacancies, with the latter being more conducive to achieving a soft landing.
How does this view align with what policymakers expect? As part of the Federal Open Market Committee’s Summary of Economic Projections (SEP), meeting participants provide their views on the projected paths for inflation and other variables over the next three calendar years. In the most recent SEP released on June 14, the median projection for core PCE inflation in 2025 was 2.2%, and the median projection for unemployment in the fourth quarter of 2025 was 4.5%. If we substitute the 2.2% projected inflation rate into our fitted nonlinear Phillips curve, we get an implied unemployment-to-vacancy ratio of around 1.3. In contrast, the value of this ratio in May 2023 was considerably lower at 0.6. According to the fitted Phillips curve, the unemployment-to-vacancy ratio would have to rise from 0.6 to 1.3 to bring inflation close to 2%. Assuming that the labor market evolves along the fitted Beveridge curve in Figure 2, the unemployment rate would need to rise from 3.7% in May 2023 to 4.6% in 2025, a value close to the SEP projection. Over the same period, the vacancy rate would need to decline from 5.9% to 3.6%.
Conclusion
Since January 2021, the 12-month core PCE inflation rate increased to a 40-year high, while the unemployment-to-vacancy ratio declined to a 50-year low. A low value of this ratio indicates a very tight labor market, making it increasingly difficult for employers to find and hire workers, thereby putting upward pressure on wages and prices. In this Letter, we estimate nonlinear Beveridge and Phillips curves that share key underlying characteristics and can account for elevated inflation readings over the past two years. Our estimates imply that, starting from current labor market conditions, the FOMC’s desired goal of a soft landing for the economy is achievable if a decline in inflation to near 2% is accompanied by a reduction in labor market tightness arising mostly from a sizable drop in job vacancies with only a modest increase in unemployment.
References
Barnichon, Regis, and Adam Hale Shapiro. 2022. “What’s the Best Measure of Economic Slack?” FRBSF Economic Letter 2022-04 (February 22).
Bok, Brandyn, Nicolas Petrosky-Nadeau, Robert G. Valletta, and Mary Yilma. 2022. “Finding a Soft Landing along the Beveridge Curve.” FRBSF Economic Letter 2022-24 (August 29).
Jørgensen, Peter Lihn, and Kevin J. Lansing. 2023. “Anchored Inflation Expectations and the Slope of the Phillips Curve.” FRB San Francisco Working Paper 2019-27 (revised February 2023).
Phillips, A. William. 1958. “The Relation between Unemployment and the Rate of Change of Money Wage Rates in the United Kingdom, 1861–1957.” Economica 25, pp. 283–299.
Opinions expressed in FRBSF Economic Letter do not necessarily reflect the views of the management of the Federal Reserve Bank of San Francisco or of the Board of Governors of the Federal Reserve System. This publication is edited by Anita Todd and Karen Barnes. Permission to reprint portions of articles or whole articles must be obtained in writing. Please send editorial comments and requests for reprint permission to research.library@sf.frb.org