The collapse of an asset price bubble usually creates a great deal of economic disruption. But bubbles are hard to anticipate and costly to deflate. As a result, policymakers struggle to determine how they should respond, if at all. Evaluating the economic costs of past equity and real estate bubbles—with particular attention to how much credit grew during boom phases—can provide valuable insights for this debate. A recent study finds that equity bubbles are relatively benign. More danger comes from housing bubbles in which credit grows rapidly.
Asset price booms pose a challenge for monetary policy. It is difficult to separate optimism justified by future prospects about underlying fundamentals from optimism fueled by speculation about future prices alone. Matters are made worse when borrowed money is involved, as Fisher (1933, p. 341) reminds us. Sometimes the economic consequences of the boom-bust cycle typical of a bubble are well contained. A good example is the dot-com boom and bust of information technology stocks in the early 2000s. Other times the consequences are dire, as the collapse of the housing market and the Great Recession taught us.
How should a central bank respond to an asset price boom? Rudebusch (2005) provides a detailed road map. It all depends on how early one can tell that there is a bubble, and whether the costs of different policy interventions outweigh the benefits. Central banks monitor asset markets closely since they provide timely information on broader economic conditions. However, it is often difficult to tell the signal from the noise. Fluctuations in asset prices reflect a varying mix of fundamentals and speculation. Uncertainty about these mixed signals has often stayed the hand of policymakers, much like a monetary version of the Hippocratic admonition, “First, do no harm.”
There are good reasons to be cautious. When it comes to interest rate policy, the evidence seems to suggest that it is often best to “clean” rather than “lean.” Using estimates available from a wide variety of sources, Williams (2015) calculates that the interest rate hikes needed to prevent the housing boom of the mid-2000s would have inflicted a deeper economic slowdown than the Great Recession. However, these estimates are inevitably imprecise. On the opposite side of the ledger, Borio and Lowe (2002) argue for more forceful interest rate policy in low inflation environments while recognizing that it is difficult to identify financial imbalances in advance.
Our recent research (Jordà, Schularick and Taylor 2015) examines the connection between asset price bubbles, credit growth, and macroeconomic outcomes. This Economic Letter presents our estimates of the economic costs of bubbles in equities and in real estate under a variety of credit scenarios. Bubbles happen somewhat infrequently, and seldom in housing markets. To maximize the sample of such episodes, we reach back in history to 1870 and look beyond the United States to 16 additional advanced economies (the complete list is available in Jordà et al. 2015).
Credit booms and asset price bubbles
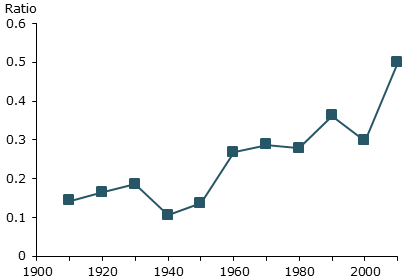
A defining feature of advanced economies in the post-World War II era is the rise of credit documented in Jordà, Schularick, and Taylor (2016). This is visible in Figure 1, which displays the cross-country average ratio to GDP of unsecured and mortgage lending since 1870. Following a period of relative stability, both lending ratios grew rapidly after the war, with mortgages taking off in the mid-1980s. As a result, households have become more leveraged than ever. This is seen in Figure 2, which displays the ratio of the total value of mortgage lending to the value of the stock of U.S. housing. Before World War I that ratio stood at around 0.15, but since then the ratio has more than tripled.
Figure 1
Average ratio to GDP of unsecured and mortgage bank credit
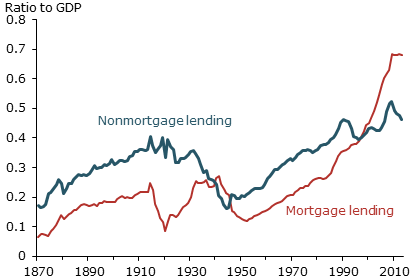
Figure 2
Ratio of total mortgages to total value of U.S. housing stock
Most buyers use mortgages to buy homes, but few savers use borrowed funds to invest in the stock market. Thus, one might expect equity price busts to be less dangerous than collapses in house prices: A crash in the price of assets financed with external (rather than internal) funds is likely to have deeper effects on the economy. As collateral values evaporate, some agents will delever to reduce their debt burden, in turn causing a further collapse in asset prices and in aggregate demand. The more widespread this type of leverage is, the more extensive the damage to the economy. Integrating the role of credit into the analysis of asset price bubbles is therefore critical.
What is a bubble and how would you measure it?
There is no widely accepted definition of what an asset price bubble is. Intuitively, it is a situation where asset prices drift up from their fundamental value, that is the current valuation of the expected stream of payoffs, and then fall abruptly. And therein lies the rub. The fundamental value is neither directly observable nor easy to determine. Borio and Lowe (2002), Bordo and Jeanne (2002), Detken and Smets (2004), and Goodhart and Hofmann (2008) all use, one way or another, large deviations of asset prices from some reference level or booms and subsequent busts to identify bubble episodes.
We follow a two-pronged approach. First, we focus on spells of sizable asset price run-up—an event we expect to see less than one-third of the time in the data—and a subsequent collapse in prices of 15% or more. This simple rule of thumb would identify events such as the U.S. Great Depression, the mid-1980s Japanese real estate collapse, the 2000s dot-com boom and bust, and the recent collapse of housing markets in many countries. This is, of course, a backward-looking measure meant to sort the historical record for analysis. It is not designed to be a bubble-forecasting tool.
Bubbles and the business cycle
Asset price bubbles are often associated with financial crises and recessions. We are careful not to attribute causality—a collapse in equity prices could reflect the markets’ response to a recession caused by other factors. However, the link between bubbles, recessions, and financial crises is a strong one. In the postwar era, 21 out of 23 financial crises in our sample are associated with what we would label a “bubble.” Nearly half of them (11 of 23) involve bubbles in both equities and real estate at the same time. Even run-of-the-mill recessions tend to coincide with burst bubbles. About two-thirds of all postwar recessions, 41 out of 65, are associated with bubble episodes. The majority of these recession-plus-bubble episodes, 30 out of 41, involve equity bubbles only. Housing bubbles are relatively rare—but it is revealing that, when they occur, there are better than even odds that the bubble will burst into a financial crisis.
The economic cost of bubbles
Although not every bubble ends in recession, clearly many do. Thus, a natural way to calculate the costs of bubbles is in terms of the path that the economy follows in recessions (see Lansing 2011 for an alternative calculation). Two questions in particular are central to our analysis: (1) Does credit make any difference to how we think about the aftermath of bubbles? (2) Are housing price bubbles more dangerous than equity bubbles? The answer to each of these questions turns out to be yes.
Beginning with the sample of all recessions in 17 advanced economies over the past 150 years, we stratify the data according to how much credit built up during the boom as well as whether the economy experienced a bubble in equities, housing, both, or neither. Furthermore, to guard against the influence that the Great Recession may have on our results (clearly an important event for many countries in our sample), we exclude data from 2007 and beyond.
Figure 3 presents the key results. Both panels show the average path of real GDP per capita of economies through recessions and recoveries when growth of credit in the expansion is at its average historical value and in the absence of asset price bubbles. This path is displayed as a solid blue line with a shaded 90% confidence interval. In normal recessions, the economy shrinks in year one by about 1% but recovers the previous peak level of output by year two. It continues to grow thereafter, and by year five, GDP per capita is about 7% higher than when the recession started.
Figure 3
Average recession and recovery paths
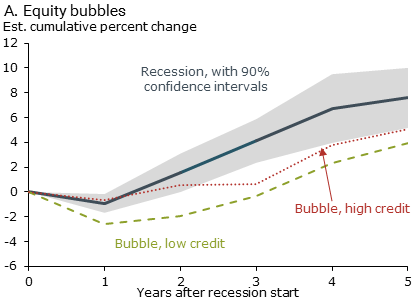
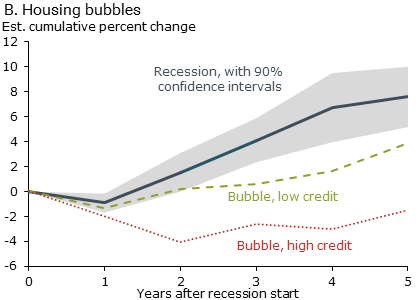
Source: Jordà, Schularick, and Taylor (2016).
Next we can stratify the results and examine cases where there is a bubble and when credit grows above or below its mean during the preceding expansion. A green dashed line denotes a bubble where credit grows below mean, and a red dotted line shows a bubble where credit grows above mean instead.
In panel A, compared with normal recessions, those coinciding with an equity bubble are slightly deeper, with an initial decline of about 2%, but tend to recover in a way that is parallel to normal recessions. By the fifth year after the start of the recession, GDP per capita is about 4% higher. More importantly, the path of the recovery is relatively unaffected by how much credit grows in the expansion.
In statistical terms, there is no significant difference between the two. In contrast, panel B of the figure shows that for housing bubbles the recession is deeper and the recovery slower than in normal recessions. And the more credit grows in the expansion, the more dangerous the situation gets. High credit growth coupled with a housing bubble coincides with a path for GDP per capita that stays in negative territory even five years after the start of the recession. In fact, looking outside our sample, the path that the United States experienced in the Great Recession is strikingly similar to the historical average path of an economy experiencing a leveraged housing bubble.
Conclusion
Financial crises often follow credit and asset price booms that collapse abruptly. But many booms in credit and asset prices do not end up in a crisis or even in a garden-variety recession. This is the policymaker’s conundrum, to distinguish booms driven by speculation from those driven by fundamental economic forces.
To ward against financial instability, policymakers have three arrows in their quiver: financial regulation, macroprudential frameworks, and interest rate policy. Few disagree on the first two arrows. However, views diverge on whether interest rate policy should be used for purposes other than to meet inflation and full employment mandates.
We cannot provide a definitive answer to this debate. However, our research highlights the need to pay particular attention to conditions in housing and mortgage markets, rather than those in equity markets. The collapse of a leveraged housing market is still as dangerous today as it has always been.
Òscar Jordà is a vice president in the Economic Research Department of the Federal Reserve Bank of San Francisco.
Moritz Schularick is a professor of economics at the University of Bonn.
Alan M. Taylor is a professor of economics and finance at the University of California, Davis.
References
Bordo, Michael, and Olivier Jeanne. 2002. “Monetary Policy and Asset Prices: Does ‘Benign Neglect’ Make Sense?” International Finance 5(2), pp. 139–164.
Borio, Claudio, and Philip Lowe. 2002. “Asset Prices, Financial and Monetary Stability: Exploring the Nexus.” Bank for International Settlements Working Paper 114. http://www.bis.org/publ/work114.htm
Detken, Carsten, and Frank Smets. 2004. “Asset Price Booms and Monetary Policy.” In Macroeconomic Policies in the World Economy, ed. Horst Siebert. Berlin: Springer, pp. 189–227.
Goodhart, Charles, and Boris Hofmann. 2008. “House Prices, Money, Credit, and the Macroeconomy.” Oxford Review of Economic Policy 24(1), pp. 180–205.
Fisher, Irving. 1933. “The Debt-Deflation Theory of Great Depressions.” Econometrica 1, pp. 337—357.
Jordà, Òscar, Moritz Schularick, and Alan Taylor. 2015. “Leveraged Bubbles.” Journal of Monetary Economics 76, pp. s1–20.
Jordà, Òscar, Moritz Schularick and Alan Taylor. 2016. “The Great Mortgaging: Housing Finance, Crises, and Business Cycles.” Economic Policy 31(85), pp. 107–152.
Lansing, Kevin. 2011. “Gauging the Impact of the Great Recession.” FRBSF Economic Letter 2011-21 (July 11).
Rudebusch, Glenn. 2005. “Monetary Policy and Asset Price Bubbles.” FRBSF Economic Letter 2005-18 (August 5).
Williams, John. 2015. “Measuring Monetary Policy’s Effects on House Prices.” FRBSF Economic Letter 2015-28 (August 31).
Opinions expressed in FRBSF Economic Letter do not necessarily reflect the views of the management of the Federal Reserve Bank of San Francisco or of the Board of Governors of the Federal Reserve System. This publication is edited by Anita Todd and Karen Barnes. Permission to reprint portions of articles or whole articles must be obtained in writing. Please send editorial comments and requests for reprint permission to research.library@sf.frb.org