

As communities prepare for Opportunity Zones (OZ) 2.01, many are exploring strategies to make effective use of this incentive for community development. One promising approach is to consider how OZs can be layered with other tools, such as New Market Tax Credits (NMTC), Low-Income Housing Tax Credits (LIHTC), or USDA Rural Development programs. Recognizing these overlaps could support more community investments than any single program might achieve alone.
Opportunity Zones also have potential intersection with designations according to the Community Reinvestment Act (CRA)2. Multiple benefits may be realized in the same geography when banks provide capital through channels that generate CRA credit and OZ fund managers access that capital to complete transactions.
Understanding CRA and OZ Geographic Overlap
CRA and OZs each have their own eligibility criteria with a focus on lower-income census tracts3. According to federal data4, 75% of census tracts eligible to be designated as OZs under 2.0 would also qualify for CRA consideration5 (18,968 of the nation’s 25,332 OZ-eligible tracts). This substantial overlap creates potential opportunities for community development projects to layer OZ investments and bank investments that may qualify for CRA credit.
While the overlap between OZ-eligible tracts and tracts that meet CRA’s definition of low- and moderate-income (LMI) is extensive, it does vary depending on the state and type of community. For instance, among the nine western states that make up the Federal Reserve’s 12th District (see figure 1), seven meet or exceed the national average for share of tracts with dual eligibility, led by Nevada and Alaska (82% and 81%, respectively). Although Idaho and Oregon lag behind the national average, the majority of OZ-eligible tracts in those states also qualify for CRA consideration (68% and 59%, respectively).
Figure 1
Share of the state’s OZ-eligible tracts that are CRA-eligible, and the proportion that are also rural
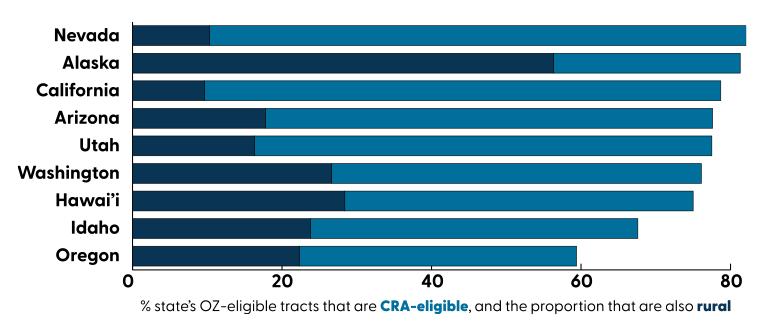
In rural areas, the overlap is also significant. Among the 8,334 rural OZ 2.0 tracts nationwide, 5,809 (69.7%) also qualify for CRA consideration (see table 1). Among 12th District states, rural tracts with dual-eligibility make up more than half of OZ-eligible tracts in Alaska (56%) and roughly one-quarter in Hawai’i, Washington, and Idaho (28%, 26%, and 24%, respectively) (Figure 1). For banks with CRA assessment areas in these rural markets, certain activities such as agricultural lending, rural business development loans, and infrastructure investments in dual-eligible tracts could potentially simultaneously advance OZ development goals and generate CRA consideration. Although, it should be noted that CRA eligibility depends not just on location, but also on whether the activity has a primary purpose of community development as defined in the CRA. Therefore, geography alone does not guarantee layered benefits.
Pathways for Bank Participation in OZs and Dual-Eligibility Communities
Given the considerable overlap between OZ- and CRA-eligible tracts, there are multiple ways in which banks can consider dual eligibility and where they might be positioned to intersect with both OZ and CRA-motivated projects.6 That range of pathways includes the following:
- Lending in a dual-eligibility tract. One pathway through which banks may get involved in OZs would be lending to projects in dual-eligibility census tracts that also layer in OZ investments. Loans in OZs could qualify for community development loans if they meet the definition of community development lending. And while banks in these cases may not directly benefit from the OZ incentive (unless they also have capital gains to invest as discussed below), the presence of the OZ designation could have implications for the pipeline of potentially investible opportunities in a community.
OZ capital may not make a project viable on its own, but it could play a catalytic role, supplying equity that allows projects to move forward when they otherwise might stall. With the permanence of the OZ 2.0 incentive, more projects in CRA-eligible locations may reach the point of being investable. For banks, this could translate into a broader set of opportunities to support transactions in lower-income communities. Those opportunities could include lending that may not be for community development purposes—for instance, small farm loans or residential lending—but still count toward a bank’s retail lending test under CRA.
- Qualified Opportunity Funds. Banks may not typically generate capital gains that make them eligible for OZ tax deferral. However, there are cases where banks do experience capital gains, which may be eligible for deferral in a Qualified Opportunity Fund (QOF) and potentially earn both OZ tax benefits and CRA credit if the investment serves a qualifying community development purpose.
- A bank could also serve as a managing member of a QOF, whether investments come from the bank itself or third-party investors. In addition to navigating compliance requirements, managers of QOFs also play a role in communicating with investors and identifying potential projects for investments, which could be informed by their CRA responsibilities and knowledge of the pipeline of community development projects in their assessment areas. And it should be noted that these latter two roles—communication and project identification—do not depend on a bank being directly involved in a QOF pathway.
- Facilitation or brokering of transactions. The substantial geographic overlap between OZ-eligible and CRA-eligible tracts means that QOFs may often be directing capital to communities where banks already have CRA responsibilities. By monitoring OZ activity in their assessment areas, banks may be able to identify investment or loan opportunities that align with their CRA strategies. They also have experience navigating the complexities that often come with investing in low-income communities, where community development projects often depend on capital stacks that layer a combination of public and private resources. Banks may be able to draw on that experience and their local networks to connect and communicate with OZ investors new to these kinds of deals, helping to advance projects that meet dual OZ and CRA objectives.
These examples are not prescriptive and do not guarantee CRA credit or direct OZ benefits, but they illustrate broad pathways through which banks might engage as OZ 2.0 activity develops. The extent to which these opportunities will be relevant will depend on project characteristics, community needs, bank capacity, and regulatory evaluation.
Conclusion
Given the extensive overlap between OZ and CRA-eligible tracts, community development practitioners could leverage both these capital sources simultaneously in nearly 19,000 census tracts across the US. This convergence may help draw more capital into stacks that combine OZ equity from tax-motivated investors and CRA-motivated debt from banks, supporting projects that may have struggled to secure conventional financing.
Once states finalize their OZ tract designations later in 2026, only 25% of the list of OZ-eligible tracts identified by Treasury will be designated as actual Opportunity Zones. But this analysis suggests there will be considerable overlap between those geographies finalized as Opportunity Zones, and LMI tracts where banks may purse CRA-related activities. Thinking of how these different tools can work together could help communities and investors position themselves strategically to advance community development goals when OZ 2.0 launches in January 2027.
Table 1
Overlap of OZ-eligibility and CRA by State
| State | Total Tracts | OZ Tracts (% of all tracts) | CRA Tracts (% of all tracts) | Both OZ & CRA (% of OZ eligible) | Rural & OZ & CRA (% of OZ eligible) | ||||
| Alaska | 177 | 32 | (18.1%) | 79 | (44.6%) | 26 | (81.3%) | 18 | (56.3%) |
| American Samoa | 18 | 16 | (88.9%) | 15 | (83.3%) | 15 | (93.8%) | 15 | (93.8%) |
| Arizona | 1,765 | 500 | (28.3%) | 576 | (32.6%) | 388 | (77.6%) | 89 | (17.8%) |
| California | 9,129 | 2,469 | (27.0%) | 2,935 | (32.2%) | 1,944 | (78.7%) | 238 | (9.6%) |
| Cmlth N Mariana Islands | 26 | 19 | (73.1%) | 15 | (57.7%) | 15 | (78.9%) | 15 | (78.9%) |
| Guam | 57 | 20 | (35.1%) | 34 | (59.6%) | 20 | (100.0%) | 20 | (100.0%) |
| Hawaii | 461 | 88 | (19.1%) | 113 | (24.5%) | 66 | (75.0%) | 25 | (28.4%) |
| Idaho | 456 | 80 | (17.5%) | 130 | (28.5%) | 54 | (67.5%) | 19 | (23.8%) |
| Nevada | 779 | 195 | (25.0%) | 243 | (31.2%) | 160 | (82.1%) | 20 | (10.3%) |
| Oregon | 1,001 | 229 | (22.9%) | 237 | (23.7%) | 136 | (59.4%) | 51 | (22.3%) |
| Utah | 716 | 147 | (20.5%) | 191 | (26.7%) | 114 | (77.6%) | 24 | (16.3%) |
| Washington | 1,784 | 394 | (22.1%) | 540 | (30.3%) | 300 | (76.1%) | 105 | (26.6%) |
| 12th District | 16,369 | 4,189 | (25.6%) | 5,108 | (31.2%) | 3,238 | (77.3%) | 639 | (15.3%) |
| Alabama | 1,437 | 563 | (39.2%) | 561 | (39.0%) | 394 | (70.0%) | 203 | (36.1%) |
| Arkansas | 823 | 310 | (37.7%) | 371 | (45.1%) | 227 | (73.2%) | 155 | (50.0%) |
| Colorado | 1,447 | 360 | (24.9%) | 467 | (32.3%) | 302 | (83.9%) | 86 | (23.9%) |
| Connecticut | 884 | 243 | (27.5%) | 278 | (31.4%) | 209 | (86.0%) | 22 | (9.1%) |
| Delaware | 262 | 61 | (23.3%) | 62 | (23.7%) | 38 | (62.3%) | 11 | (18.0%) |
| District of Columbia | 206 | 66 | (32.0%) | 65 | (31.6%) | 55 | (83.3%) | 0 | (0.0%) |
| Florida | 5,160 | 1,360 | (26.4%) | 1,582 | (30.7%) | 1,010 | (74.3%) | 202 | (14.9%) |
| Georgia | 2,796 | 942 | (33.7%) | 1,035 | (37.0%) | 710 | (75.4%) | 306 | (32.5%) |
| Illinois | 3,265 | 950 | (29.1%) | 1,280 | (39.2%) | 804 | (84.6%) | 173 | (18.2%) |
| Indiana | 1,696 | 501 | (29.5%) | 556 | (32.8%) | 393 | (78.4%) | 83 | (16.6%) |
| Iowa | 896 | 175 | (19.5%) | 418 | (46.7%) | 134 | (76.6%) | 46 | (26.3%) |
| Kansas | 829 | 210 | (25.3%) | 323 | (39.0%) | 161 | (76.7%) | 60 | (28.6%) |
| Kentucky | 1,306 | 545 | (41.7%) | 549 | (42.0%) | 402 | (73.8%) | 276 | (50.6%) |
| Louisiana | 1,388 | 620 | (44.7%) | 552 | (39.8%) | 431 | (69.5%) | 220 | (35.5%) |
| Maine | 407 | 78 | (19.2%) | 189 | (46.4%) | 66 | (84.6%) | 63 | (80.8%) |
| Maryland | 1,475 | 451 | (30.6%) | 473 | (32.1%) | 353 | (78.3%) | 47 | (10.4%) |
| Massachusetts | 1,620 | 410 | (25.3%) | 478 | (29.5%) | 339 | (82.7%) | 38 | (9.3%) |
| Michigan | 3,017 | 856 | (28.4%) | 1,072 | (35.5%) | 645 | (75.4%) | 191 | (22.3%) |
| Minnesota | 1,505 | 289 | (19.2%) | 467 | (31.0%) | 224 | (77.5%) | 78 | (27.0%) |
| Mississippi | 878 | 404 | (46.0%) | 412 | (46.9%) | 295 | (73.0%) | 236 | (58.4%) |
| Missouri | 1,654 | 523 | (31.6%) | 615 | (37.2%) | 402 | (76.9%) | 154 | (29.4%) |
| Montana | 319 | 58 | (18.2%) | 138 | (43.3%) | 42 | (72.4%) | 29 | (50.0%) |
| Nebraska | 553 | 112 | (20.3%) | 228 | (41.2%) | 95 | (84.8%) | 23 | (20.5%) |
| New Hampshire | 350 | 53 | (15.1%) | 82 | (23.4%) | 40 | (75.5%) | 26 | (49.1%) |
| New Jersey | 2,181 | 516 | (23.7%) | 659 | (30.2%) | 428 | (82.9%) | 26 | (5.0%) |
| New Mexico | 612 | 257 | (42.0%) | 232 | (37.9%) | 179 | (69.6%) | 112 | (43.6%) |
| New York | 5,411 | 1,702 | (31.5%) | 1,660 | (30.7%) | 1,186 | (69.7%) | 172 | (10.1%) |
| North Carolina | 2,672 | 807 | (30.2%) | 918 | (34.4%) | 597 | (74.0%) | 301 | (37.3%) |
| North Dakota | 228 | 37 | (16.2%) | 112 | (49.1%) | 31 | (83.8%) | 15 | (40.5%) |
| Ohio | 3,168 | 1,032 | (32.6%) | 1,079 | (34.1%) | 805 | (78.0%) | 195 | (18.9%) |
| Oklahoma | 1,205 | 413 | (34.3%) | 489 | (40.6%) | 317 | (76.8%) | 143 | (34.6%) |
| Pennsylvania | 3,446 | 866 | (25.1%) | 972 | (28.2%) | 617 | (71.2%) | 172 | (19.9%) |
| Puerto Rico | 981 | 712 | (72.6%) | 307 | (31.3%) | 302 | (42.4%) | 119 | (16.7%) |
| Rhode Island | 250 | 55 | (22.0%) | 65 | (26.0%) | 46 | (83.6%) | 0 | (0.0%) |
| South Carolina | 1,323 | 445 | (33.6%) | 462 | (34.9%) | 307 | (69.0%) | 220 | (49.4%) |
| South Dakota | 242 | 52 | (21.5%) | 118 | (48.8%) | 44 | (84.6%) | 28 | (53.8%) |
| Tennessee | 1,701 | 507 | (29.8%) | 566 | (33.3%) | 374 | (73.8%) | 148 | (29.2%) |
| Texas | 6,896 | 2,420 | (35.1%) | 2,567 | (37.2%) | 1,836 | (75.9%) | 358 | (14.8%) |
| US Virgin Islands | 32 | 18 | (56.3%) | 23 | (71.9%) | 18 | (100.0%) | 18 | (100.0%) |
| Vermont | 193 | 24 | (12.4%) | 56 | (29.0%) | 14 | (58.3%) | 14 | (58.3%) |
| Virginia | 2,198 | 607 | (27.6%) | 729 | (33.2%) | 472 | (77.8%) | 208 | (34.3%) |
| West Virginia | 546 | 207 | (37.9%) | 234 | (42.9%) | 135 | (65.2%) | 135 | (65.2%) |
| Wisconsin | 1,542 | 306 | (19.8%) | 520 | (33.7%) | 236 | (77.1%) | 47 | (15.4%) |
| Wyoming | 160 | 20 | (12.5%) | 81 | (50.6%) | 15 | (75.0%) | 11 | (55.0%) |
| TOTAL | 85,529 | 25,332 | (29.6%) | 29,210 | (34.2%) | 18,968 | (74.9%) | 5,809 | (22.9%) |
End Notes
1. Opportunity Zones 2.0 will offer place-based investment in low-income communities
2. For the purposes of this article and its analysis, we operate under the current Community Reinvestment Act as amended in 1995.
3. A tract’s eligibility depends, in part, on whether it meets the updated 2025 Opportunity Zone criteria—median family income ≤ 70% of area median income (AMI) or poverty rate ≥ 20% with median income ≤ 125% of AMI—and the CRA criteria, which consider low‑income (<50% AMI) or moderate‑income (50–80% AMI) tracts as CRA‑eligible.
For more info on OZ: 26 U.S. Code § 1400Z-2 – Special rules for capital gains invested in opportunity zones.
For more info on CRA: 12 CFR 345.12(m) (Mar. 29, 2024)
4. Analysis based on Treasury OZ 2.0 designations (Excel, 5.9 kb) and FFIEC Census Flat File 2025 data covering 87,276 census tracts nationwide (Zip, 92.5 kb).
5. 12 CFR 345.12(m) (Mar. 29, 2024)
6. See also: OCC Community Developments Fact Sheet. Opportunity Zones. August 2020
Acknowledgement
The authors would like to thank their colleagues across the Federal Reserve System—Cayla Matsumoto (Board), Jessica Farr (ATL), and Micah Spector (PHL)—for their insightful external review and feedback on this piece leading up to publication.
Community Engagement and Analysis works to understand the economic experiences of lower-income households and communities to help build a stronger economy for all Americans. This work contributes to the Federal Reserve Bank of San Francisco’s work to support monetary policy, strengthen financial institutions, and enhance payment systems.